Does Organized Offense Mean "Better" Offense for the 2025-2026 New York Knicks?
Data Analysis

Introduction
This season I worked on a project centered around meticulously dissecting New York’s offense, analyzing each half-court possession in full. The scoring player, potential assist man, shot type, shot location, self-created or assisted shots, and more. But typical box score or advanced stats don’t make this project unique. Tracking the offensive system does. Along the way, I logged every play-call and coverage faced. That data allows me to draw deep inferences about New York’s process to identify what they execute well and where they struggle. Organized offense sits at the top of that list. But first, what exactly is organized offense, and why does it matter?
Organized offense combines Play-Calling%, Help Beater%, Special Teams%, and for the Knicks specifically, Motion Offense%. In its essence, organized offense measures how often the team attacks with structure and intention rather than what we’ll refer to as “freelanced” offense. A structured offense creates advantages more reliably than a heavily freelanced one. When we hear “freelanced offense,” isolation-heavy play comes to mind, but that’s not always the case. Freelanced simply means the offense operates without a called play or structure.
Project

Abstract
To what extent does New York’s organized offense affect their overall scoring output? Does structured execution actually beat freelancing? On the surface, organized offense absolutely mattered for New York. The collected data shows the Knicks scored 1.04 points per possession (PPP) in organized half-court plays, compared to just 0.94 PPP freelancing. Expected values further prove that organized offense produces a superior offensive process. By utilizing expected points per possession (ePPP) and expected points per shot (ePPS), we can evaluate the quality of the offense regardless of whether the shot went in. Organized offense posted a stellar 1.08 ePPP against a 1.03 ePPP for freelancing. That reaffirms my pre-season thesis that structure or concepts outperform freelancing. However, data also reveals that freelancing still plays a crucial role, especially when factoring in New York’s high-end individual talent.
Methodology & Data Automation
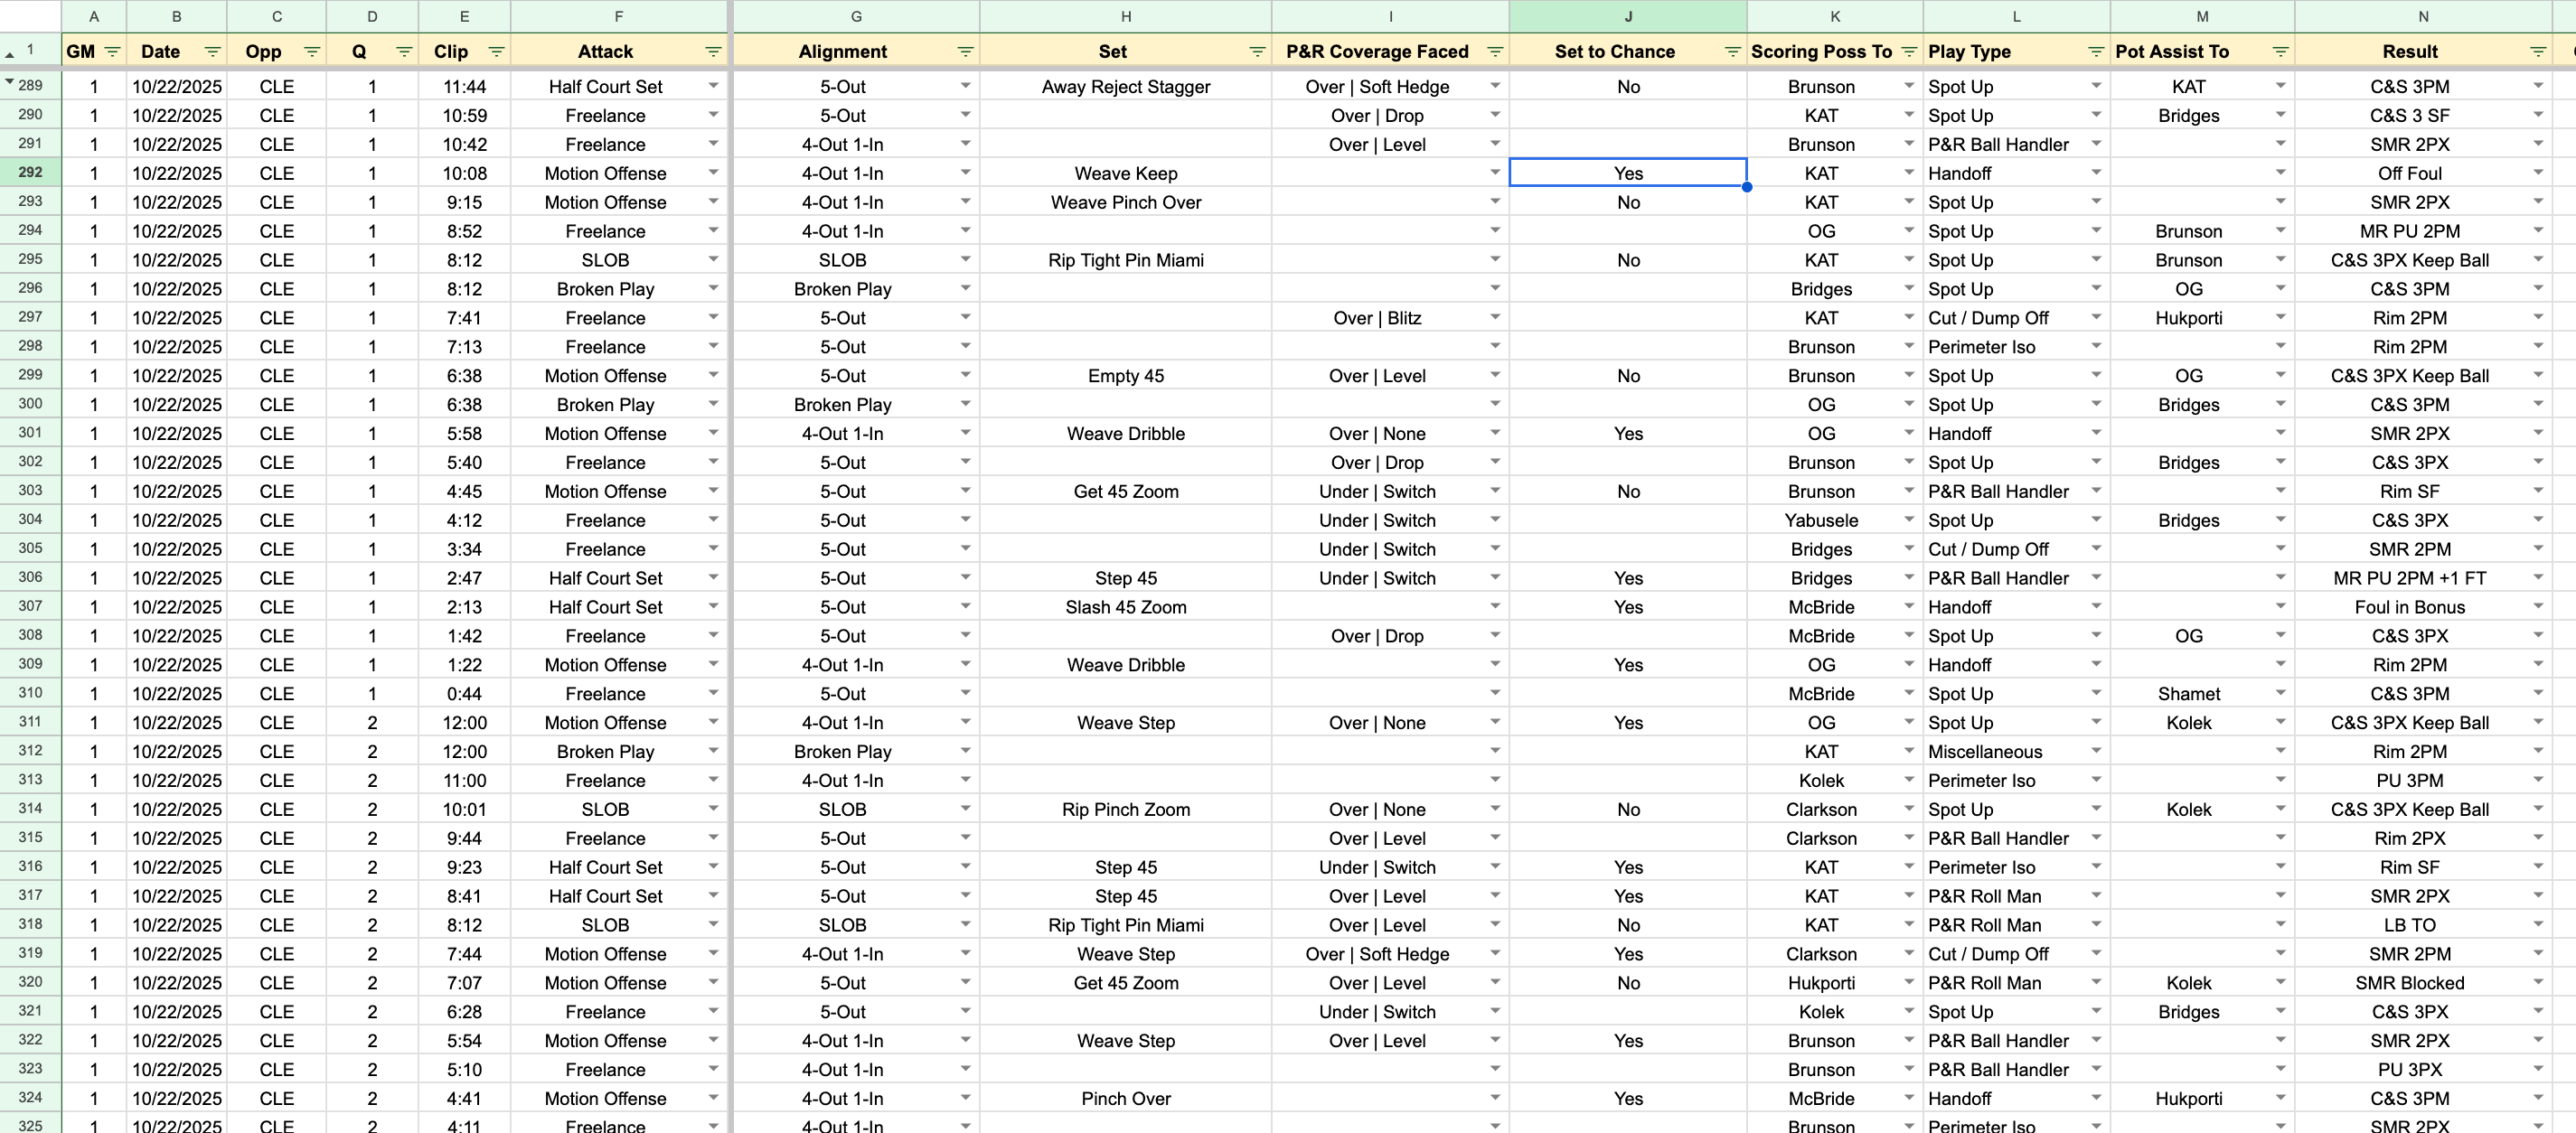
The holy grail of this project is a comprehensive Google Sheet containing a full season of logging, calculations, and tracking mechanics. Taking on a project of this scale teaches you that preparation is everything. The objective was to automate as much of the data entry as possible, minimizing manual typing even when introducing custom variables.
The data framework was divided into two distinct categories:
Manually typed in
Game, Date, Opponent, Quarter, and Lineup
Attack, Alignment, and Set Name
Main Pick-and-Roll Coverage
Set to Chance (Did the set directly lead to an end of possession?)
Scoring/Assist Player, Result, and Contests (Open, Light, Heavy or Blocked)
Defensive Help Triggers (Did the defense bring help? How many defenders?)
Automated
Lineup Tracking and Base Coverages
Screener Coverage and Offensive Series Identification
Shot Creation Type (Self-Created vs. Assisted)
Help Counters and Help Faced Status
Major Play-Type, Attack Type and Sub-Type, and Points Scored
Expected Points Per Possession (ePPP) calculation
Time (Time in Quarter, Half, Month)
System Validation (Did they run something?)
To calculate Organized Offense%, the tracker requires a manual entry for the initial attack such as a Sideline Out-of-Bounds (SLOB), Baseline Out-of-Bounds (BLOB), half-court set, or freelance possession. The sheet then automatically sorts the input into organized or freelanced bins (attack type).
Example: Half-Court Set → Organized Offense Bin
Example: SLOB Freelance → Freelance Bin
Let’s run through each of these attacks within what makes up the organized offense:
Play-Calling / Sets
Coaches call plays to gain advantages and attack specific coverages. As the season goes along, recognizing a team's play-calling gets easier. Every team runs 'series' of offense that open plays and usually build off them through various actions. Think of it like multiple car models sold under one dealership.
In the video, the 'away' action opens the away series. From the initial away screen, they can run many other actions. OG Anunoby screens while Tyler Kolek tosses the ball to the big, and they create a weak-side advantage on the roll since the opposing center plays level coverage.
Plays can target specific coverages. In this case, the handoff and double screening action create a single tagger, enabling an attack against the five playing high on the ball-screen. They can target other coverages within the same series of offense.
New York loves running screen-the-screener action out of ‘away’ to target drop coverage bigs. Brunson takes the pin-down, the center drops off, and he either shoots a catch-and-shoot three or plays off the advantage. Here, the center sets a ball-screen to get him into the lane. The Knicks can also run stack pick-and-roll to target drop coverage. Any given series typically carries multiple layers designed to attack different coverage types.
Check out this year’s playbook for more along with the video:

Help Beaters
Help beaters beat help, plain and simple. Players can direct them on their own, or coaches can build them into the system through certain spacing principles or off-screens on isolations or post-ups. They're a smart way to gain advantages that weren't there before. Read one of my favorites that I've done on this page to learn more:

Special Teams
A fancy way of saying sideline out of bounds (SLOBs) and baseline out of bounds (BLOBs) plays. Each team leads their own attack out of these inbound points. Sometimes they get extra creative, or they run a play typical of their half-court offense.


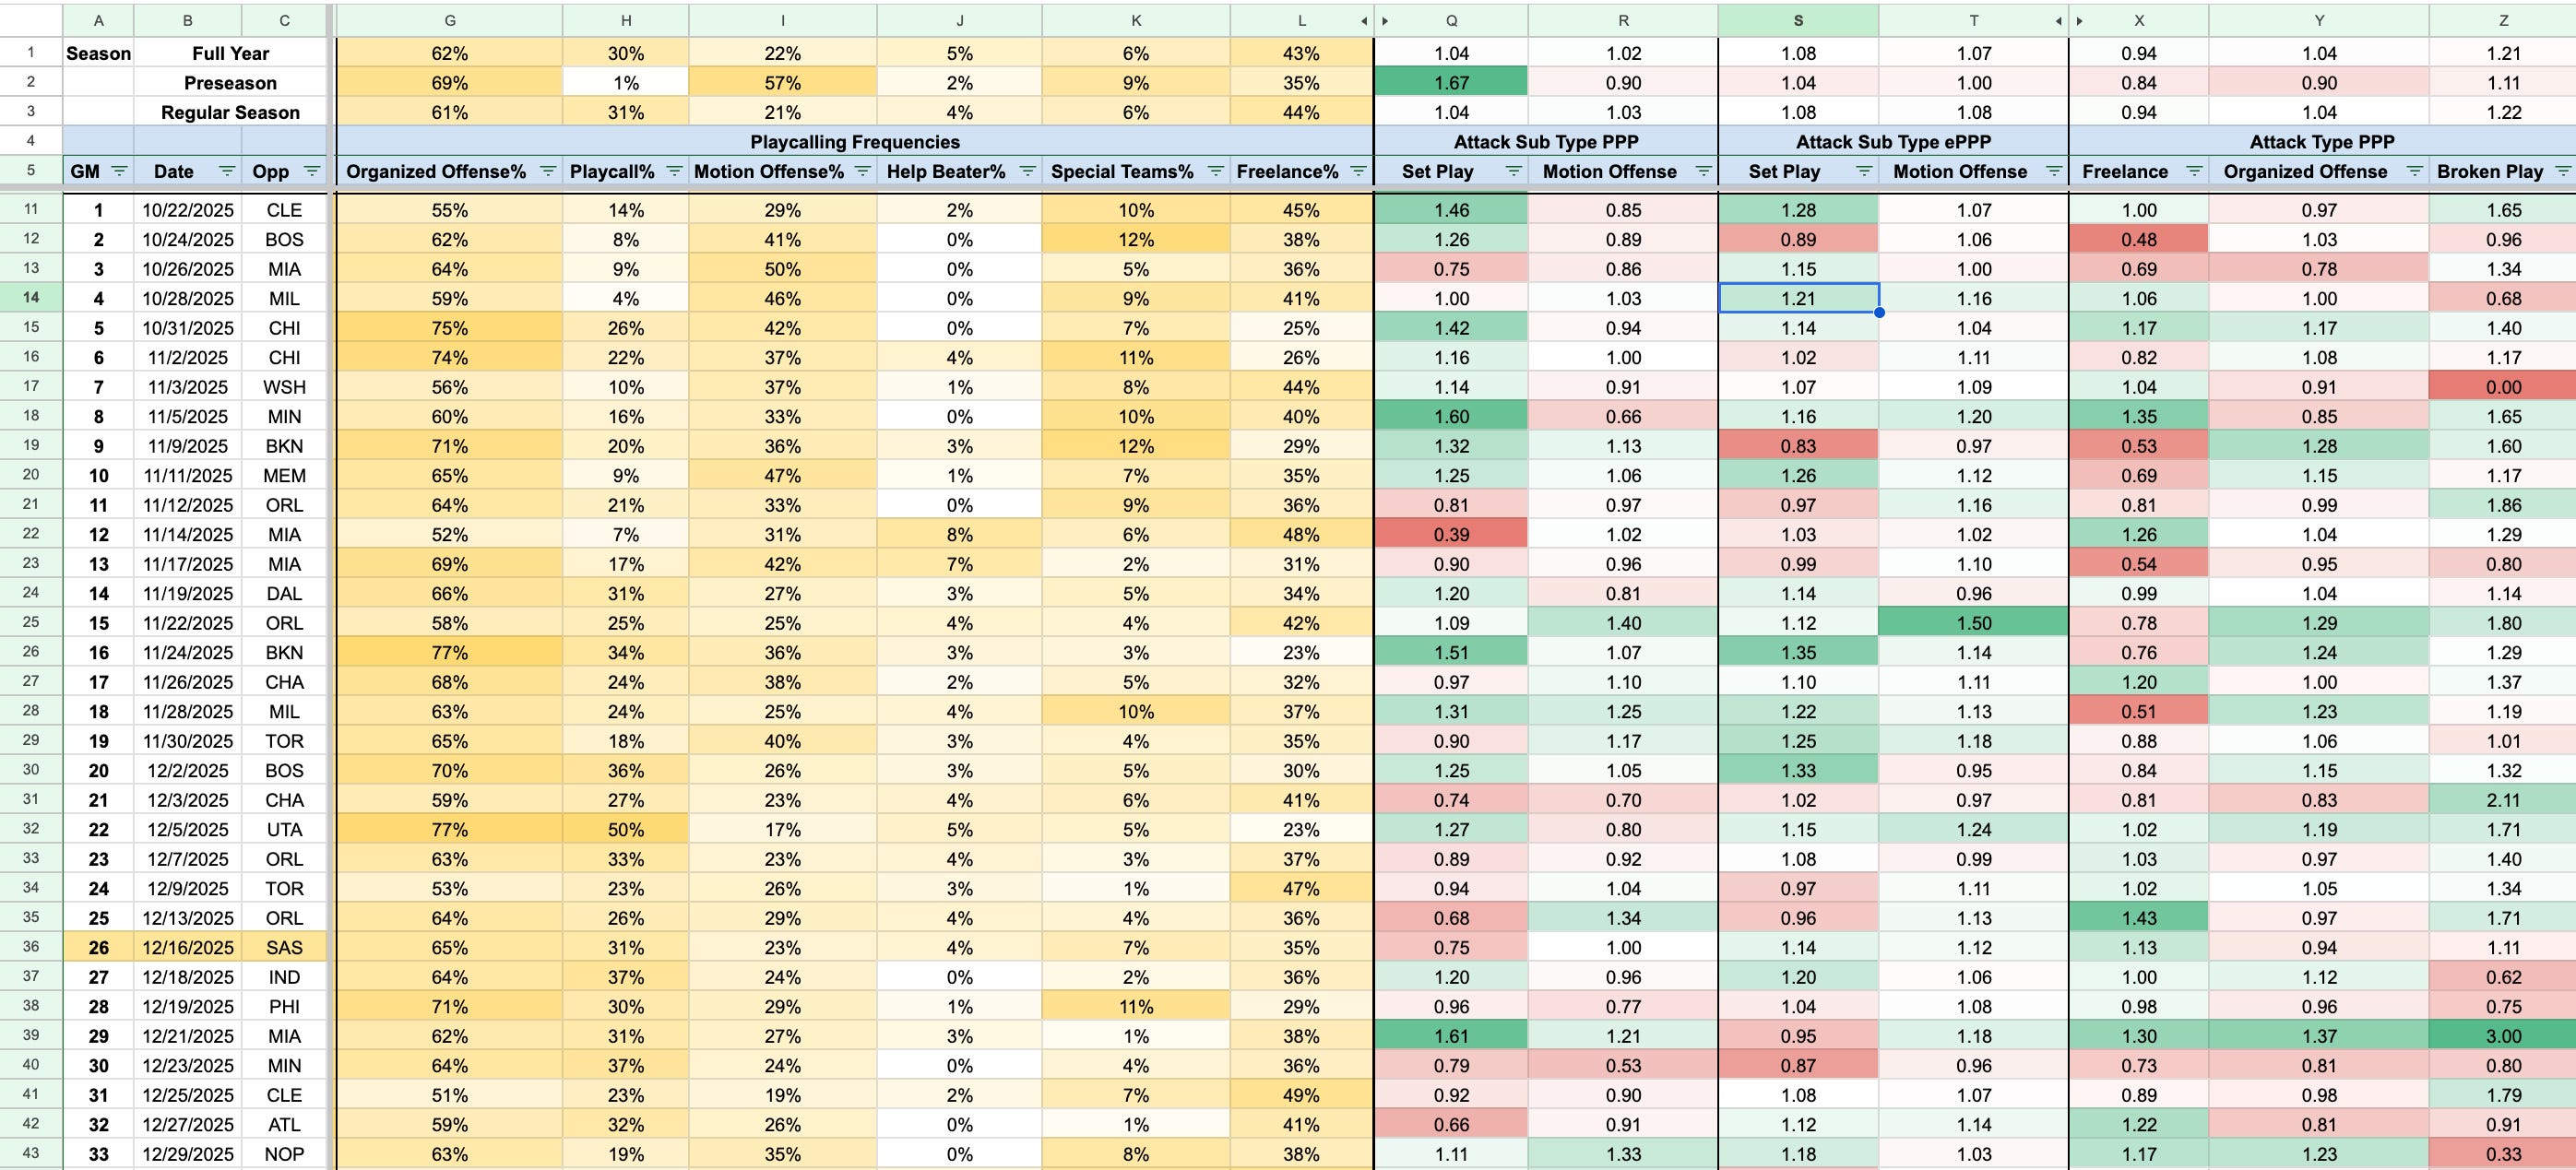
Through manual tracking and automated data, everything sorts neatly into its own column or bin. The automation handles the calculations, removing the need to run numbers manually. The tracker generates percentages for each attack type and sub-type, including PPP. There’s much more beyond what’s shown here that we will get into.
Results and Discussion
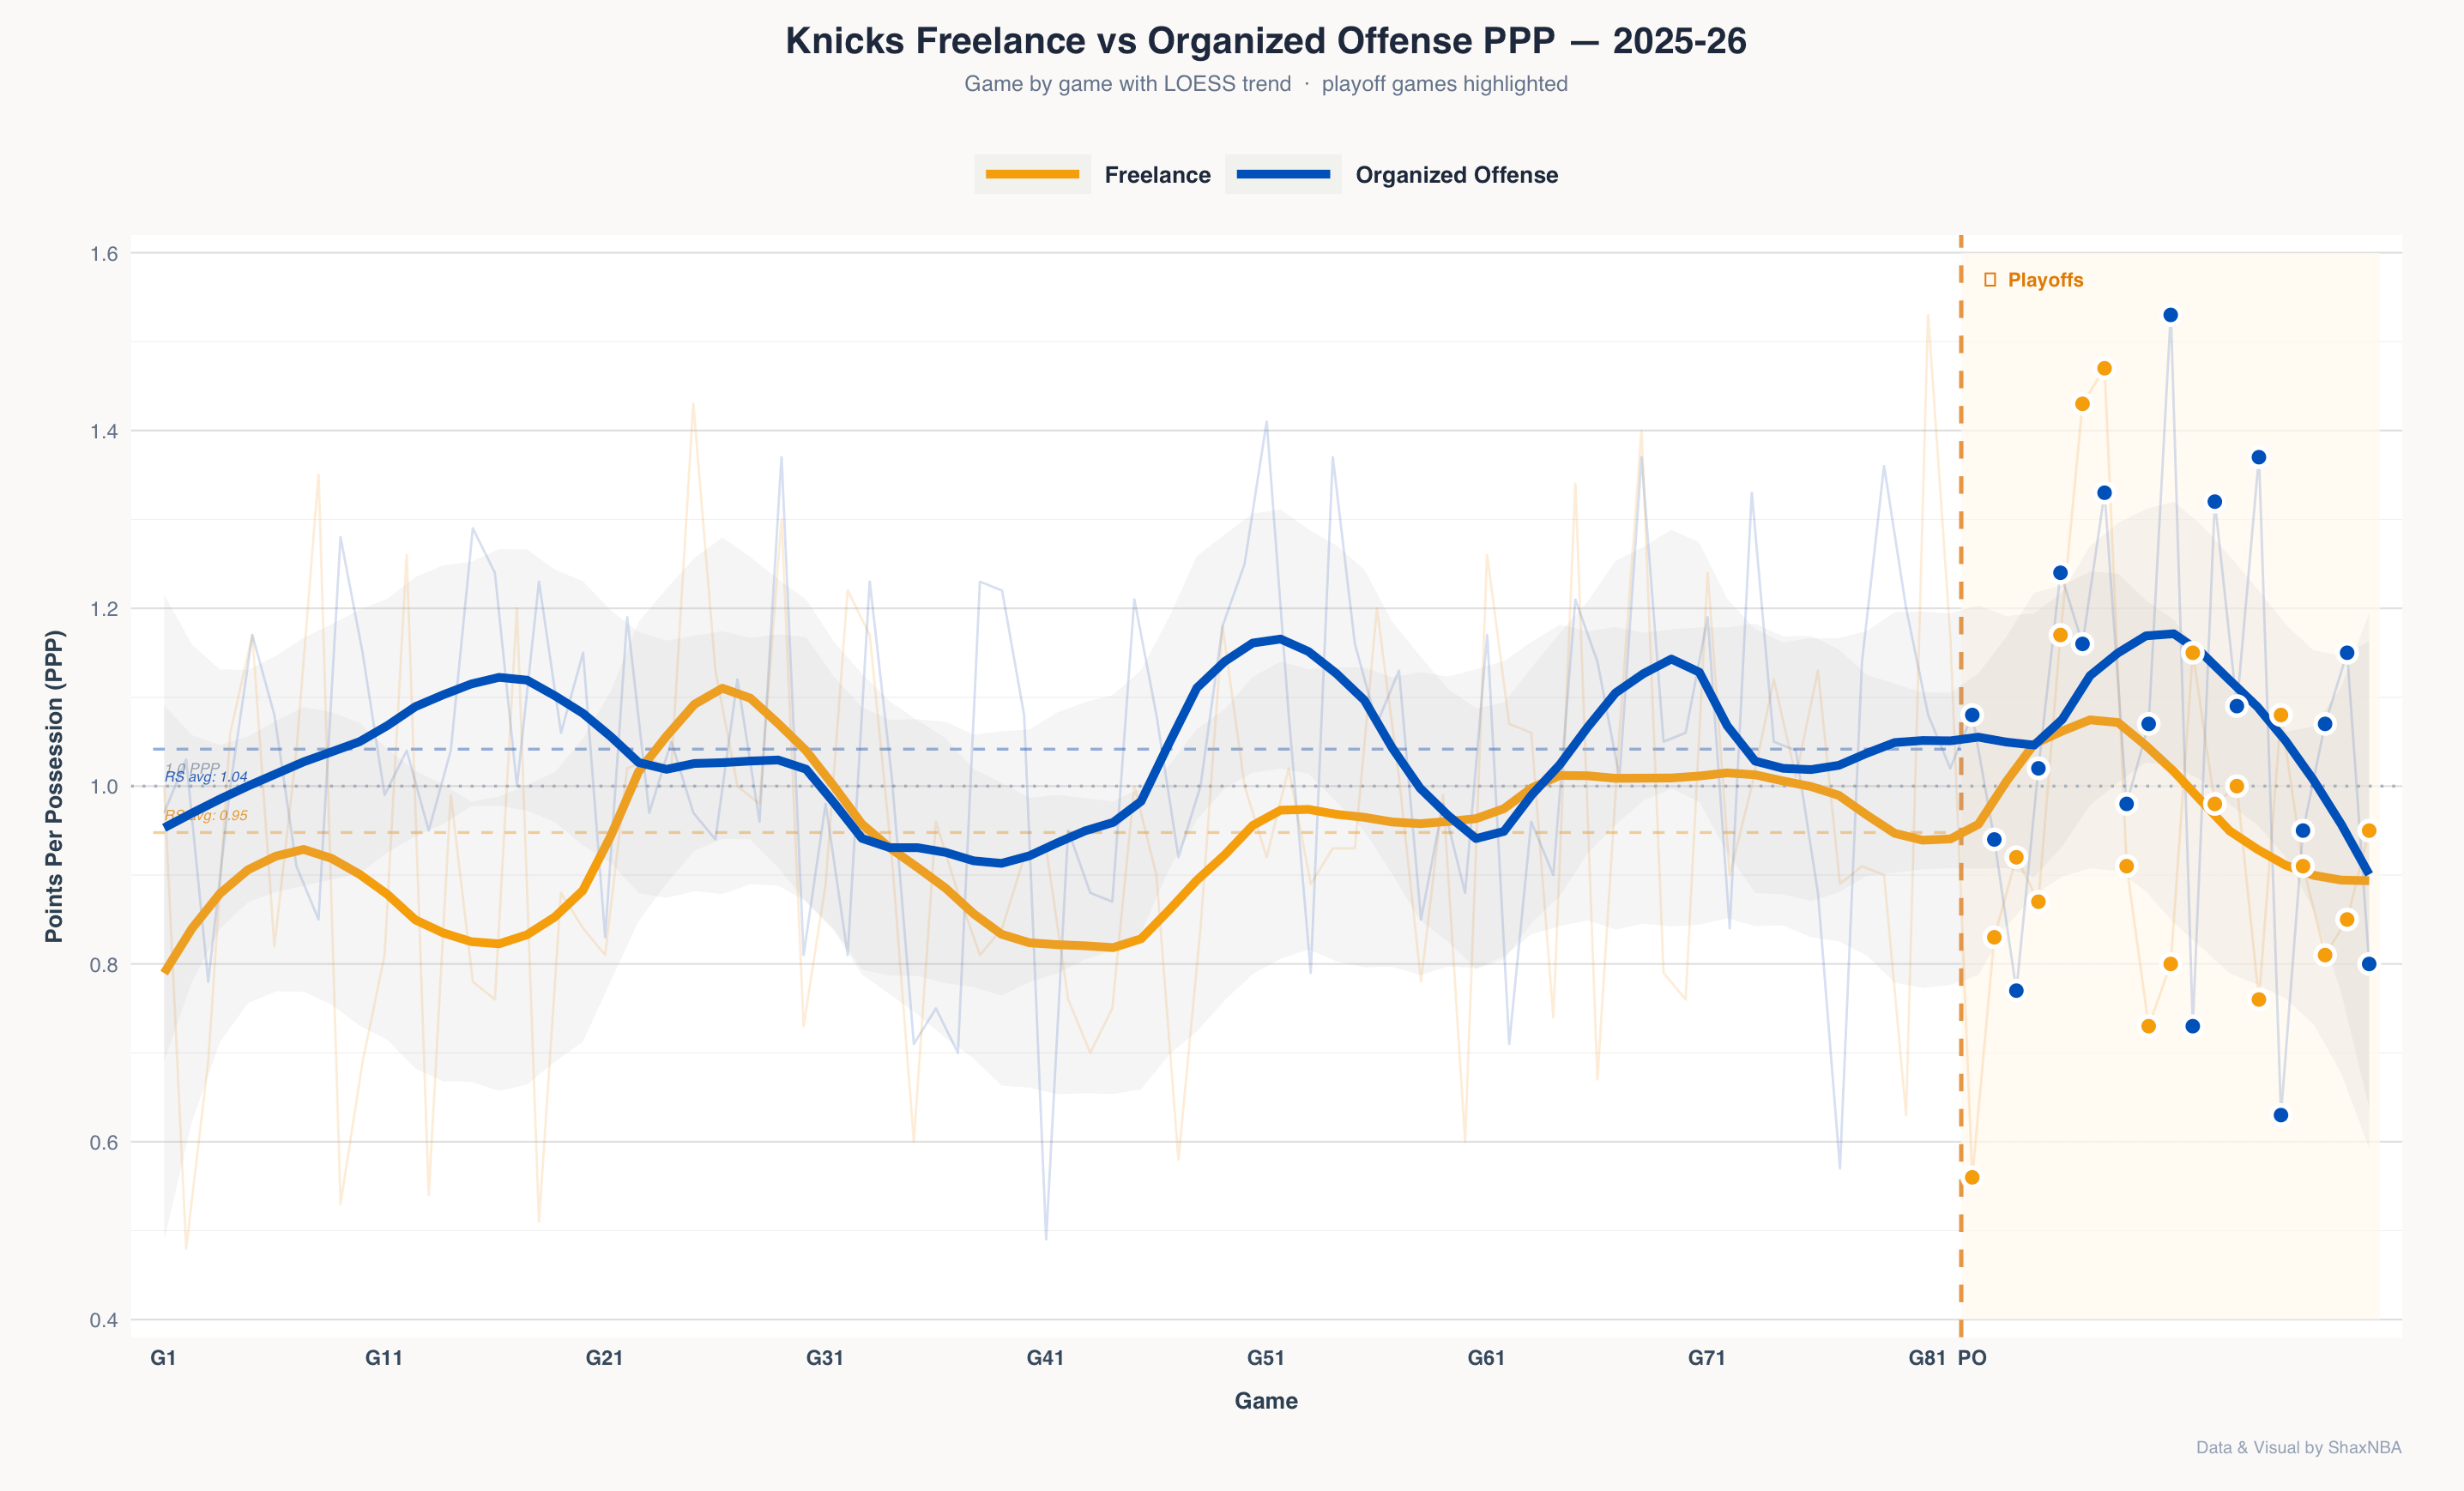
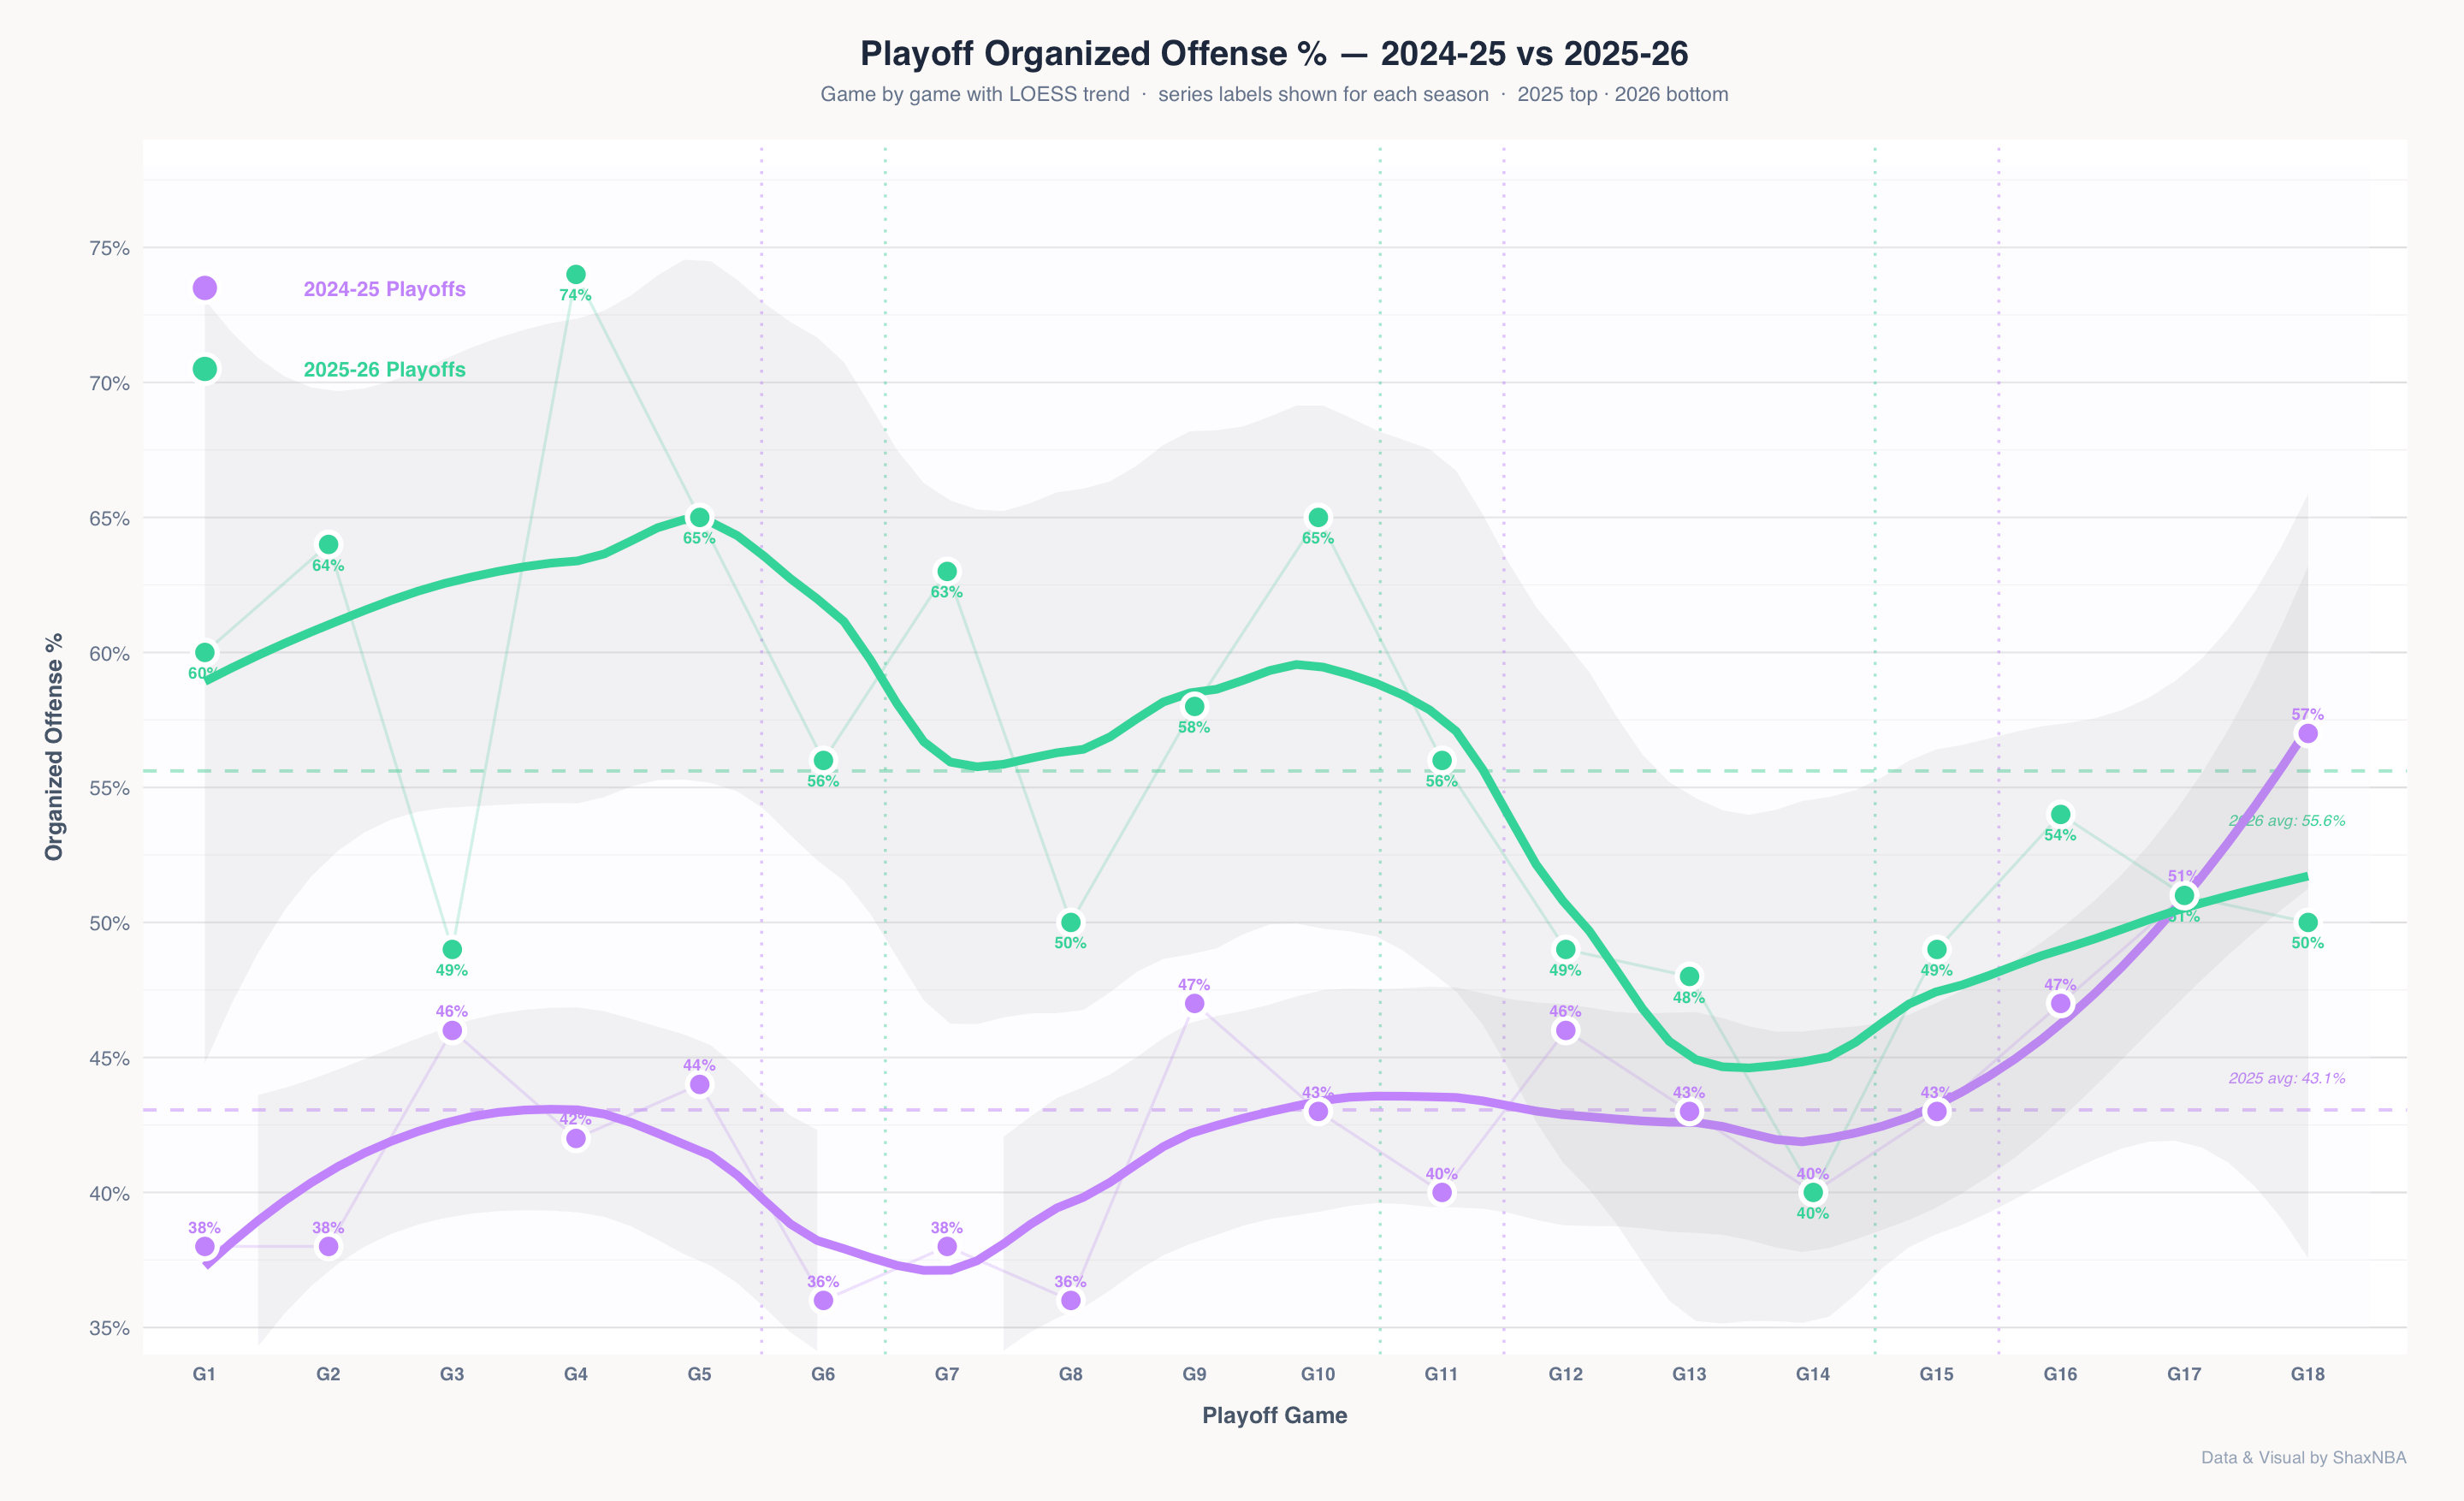
Game-by-game, organized offense PPP completely outpaces freelanced offense for much of the season and dominates the postseason. Without going too deep in this piece, notice how the offense struggled to find its footing early in the playoffs, right up until the team deviated to another approach. Despite organized offense rates of 60 and 64 percent in Games 1 and 2 against Atlanta, what type of offense the Knicks ran mattered just as much as how often they ran it. The Hawks proved adept at stopping it, holding them to 0.94 PPP in Game 2, and a brutal 0.77 PPP in Game 3 on organized plays. I broke down Game 3’s poor performance in their set-play heavy offense here:

The “new” offense begins to fade out once the Knicks run into Cleveland and San Antonio’s defenses, forcing significant adjustments, which explains the large dip in organized offense and the relative rise in freelancing. Even while going 9-1 in that stretch, the offense continuously needed to adapt to different defenses.
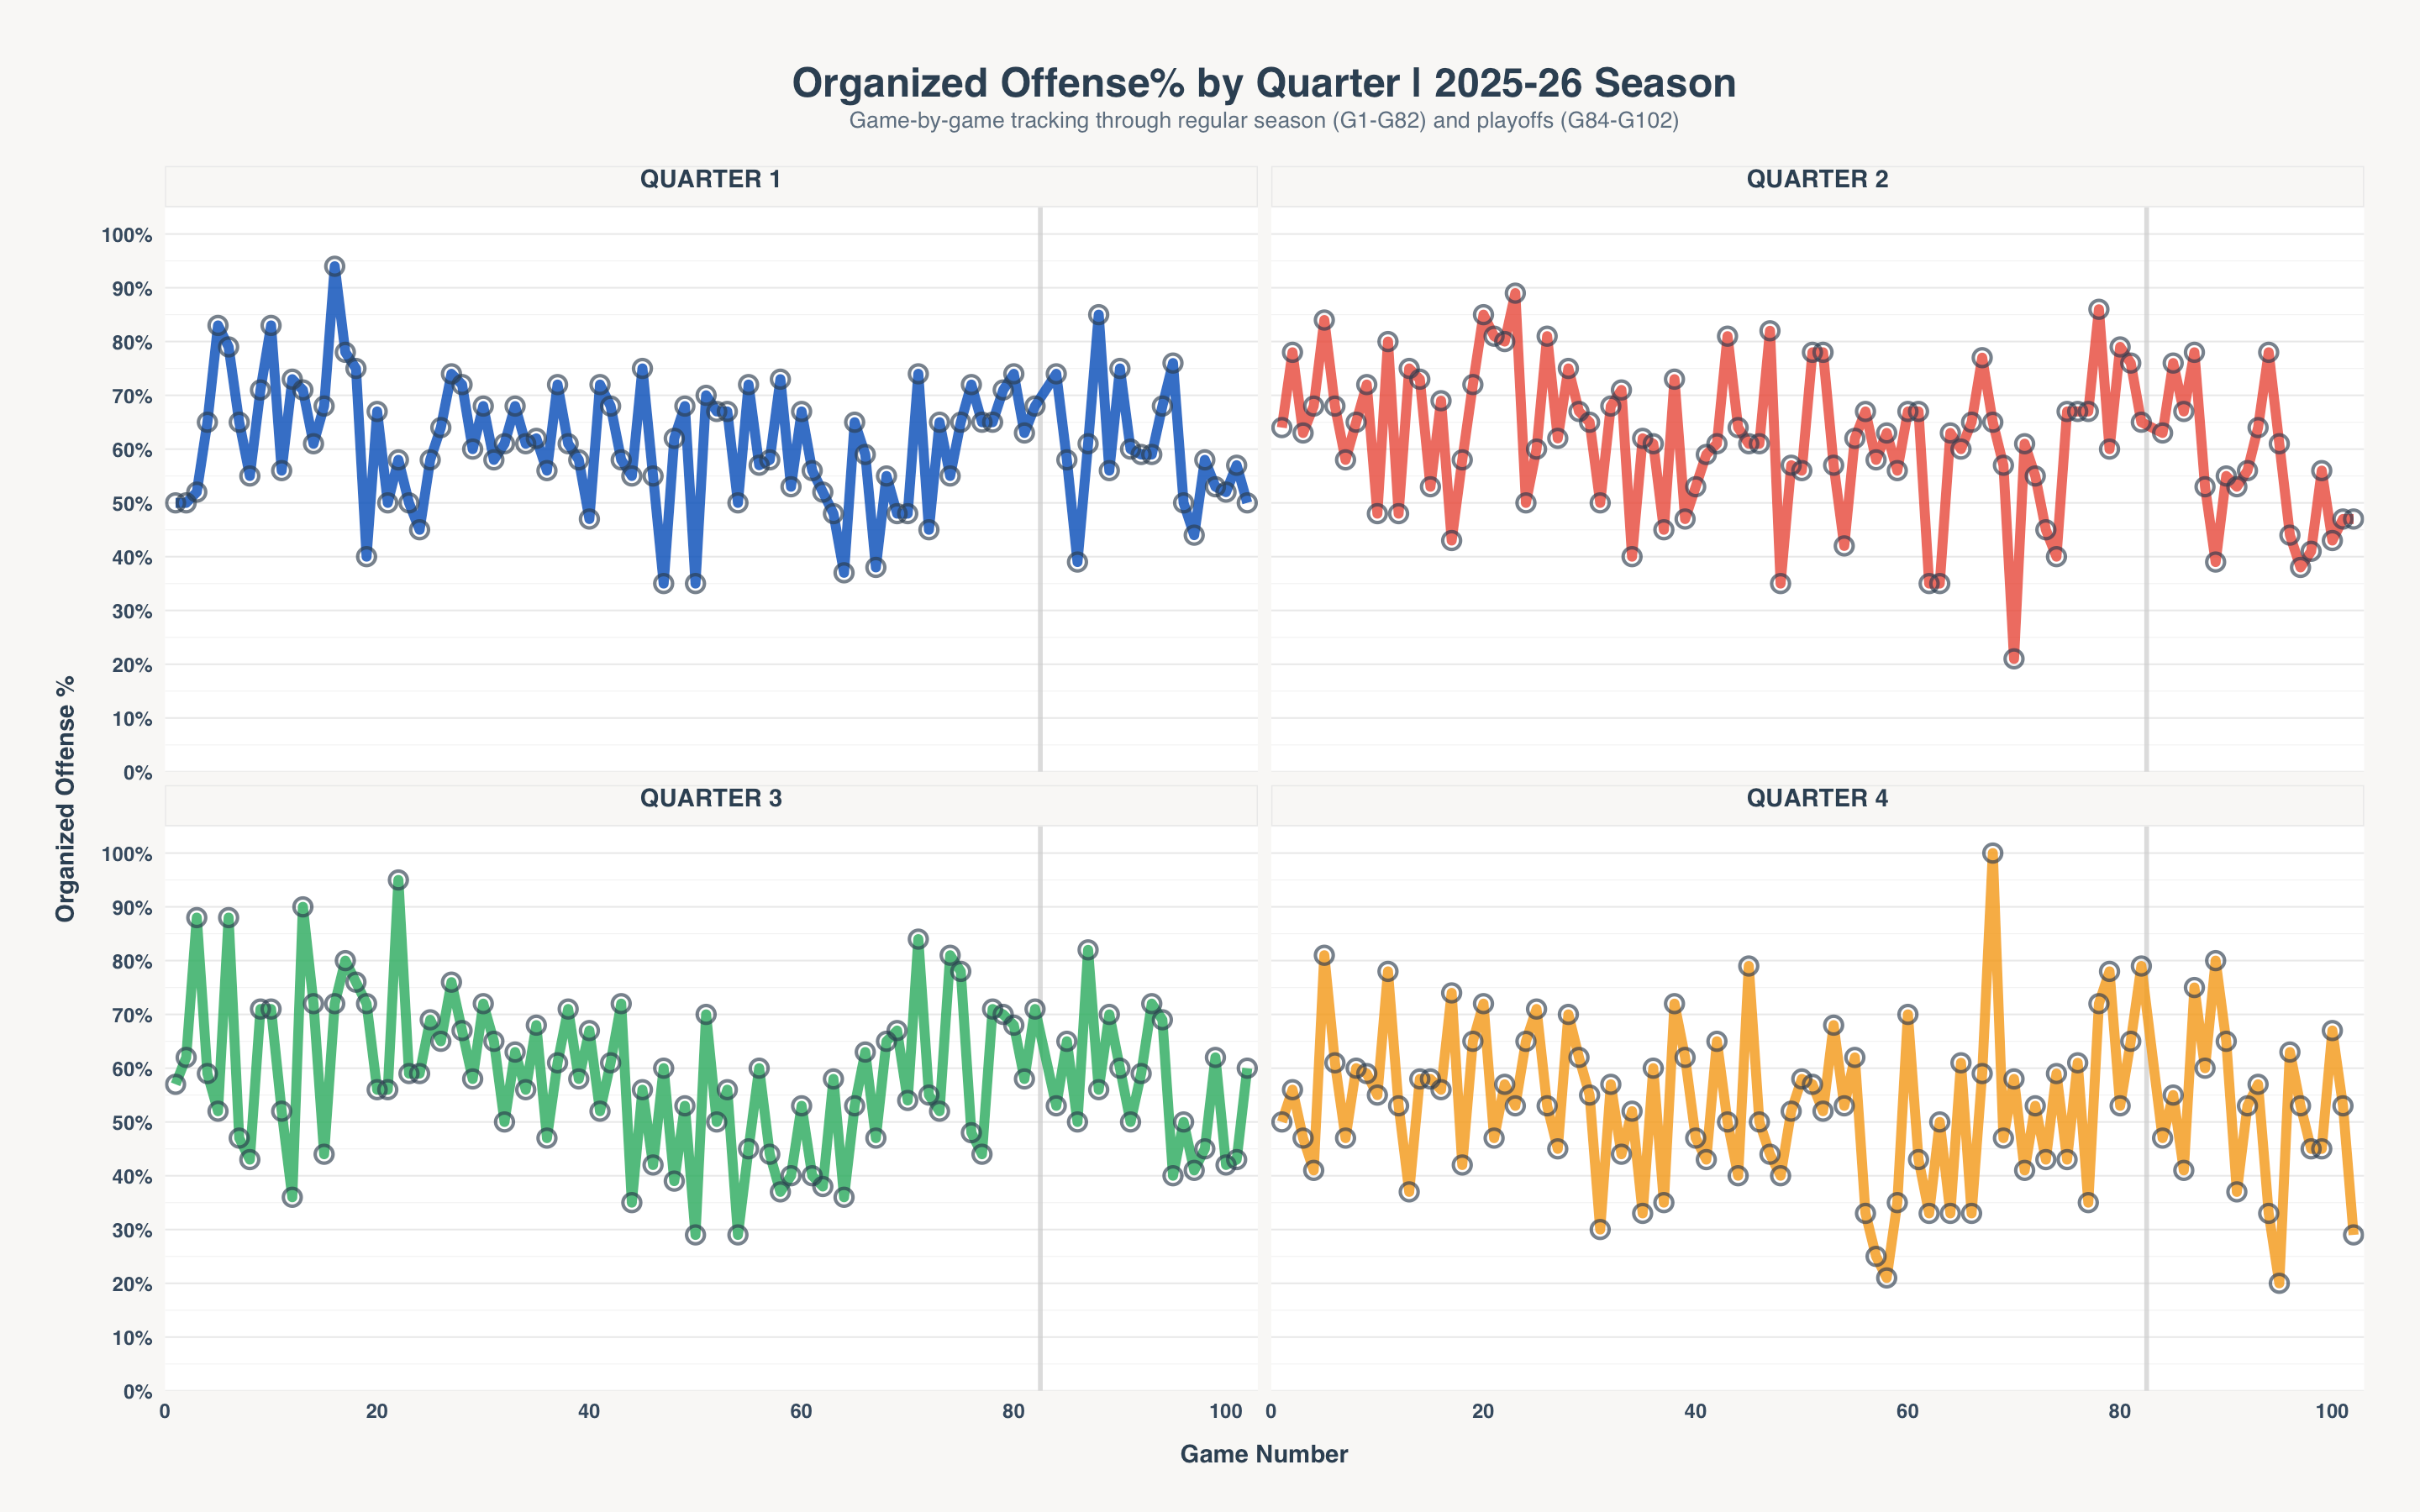
Yes, this looks like a mess, overwhelming at first glance. Narrowing the focus down to quarters within games, we can identify which quarters see the highest rates of organized offense. Organized offense declines as games progress starting at 61% in the first quarter, 62% in the second, 59% in the third, and dropping to 53% in the fourth. This drop off seems to be consistent to what I tracked a bit last season, but not as low as a Tom Thibodeau offense.
The 3rd quarter is pretty negligible, there's no real reason for the drop in offense ran, and it isn't a notable drop-off. The 4th quarter tells a different story, since we know full well it’s Jalen Brunson’s game and the Knicks have him lead the offense from the moment he checks in to the end, if it's a close game. This can start as early as 6:30 or 7 minutes left in the quarter, which in turn lowers the rate of organized offense in the quarter. Now, is this a bad thing? I attempted to tackle this question mid-season definitely check that out, as it's still relevant:

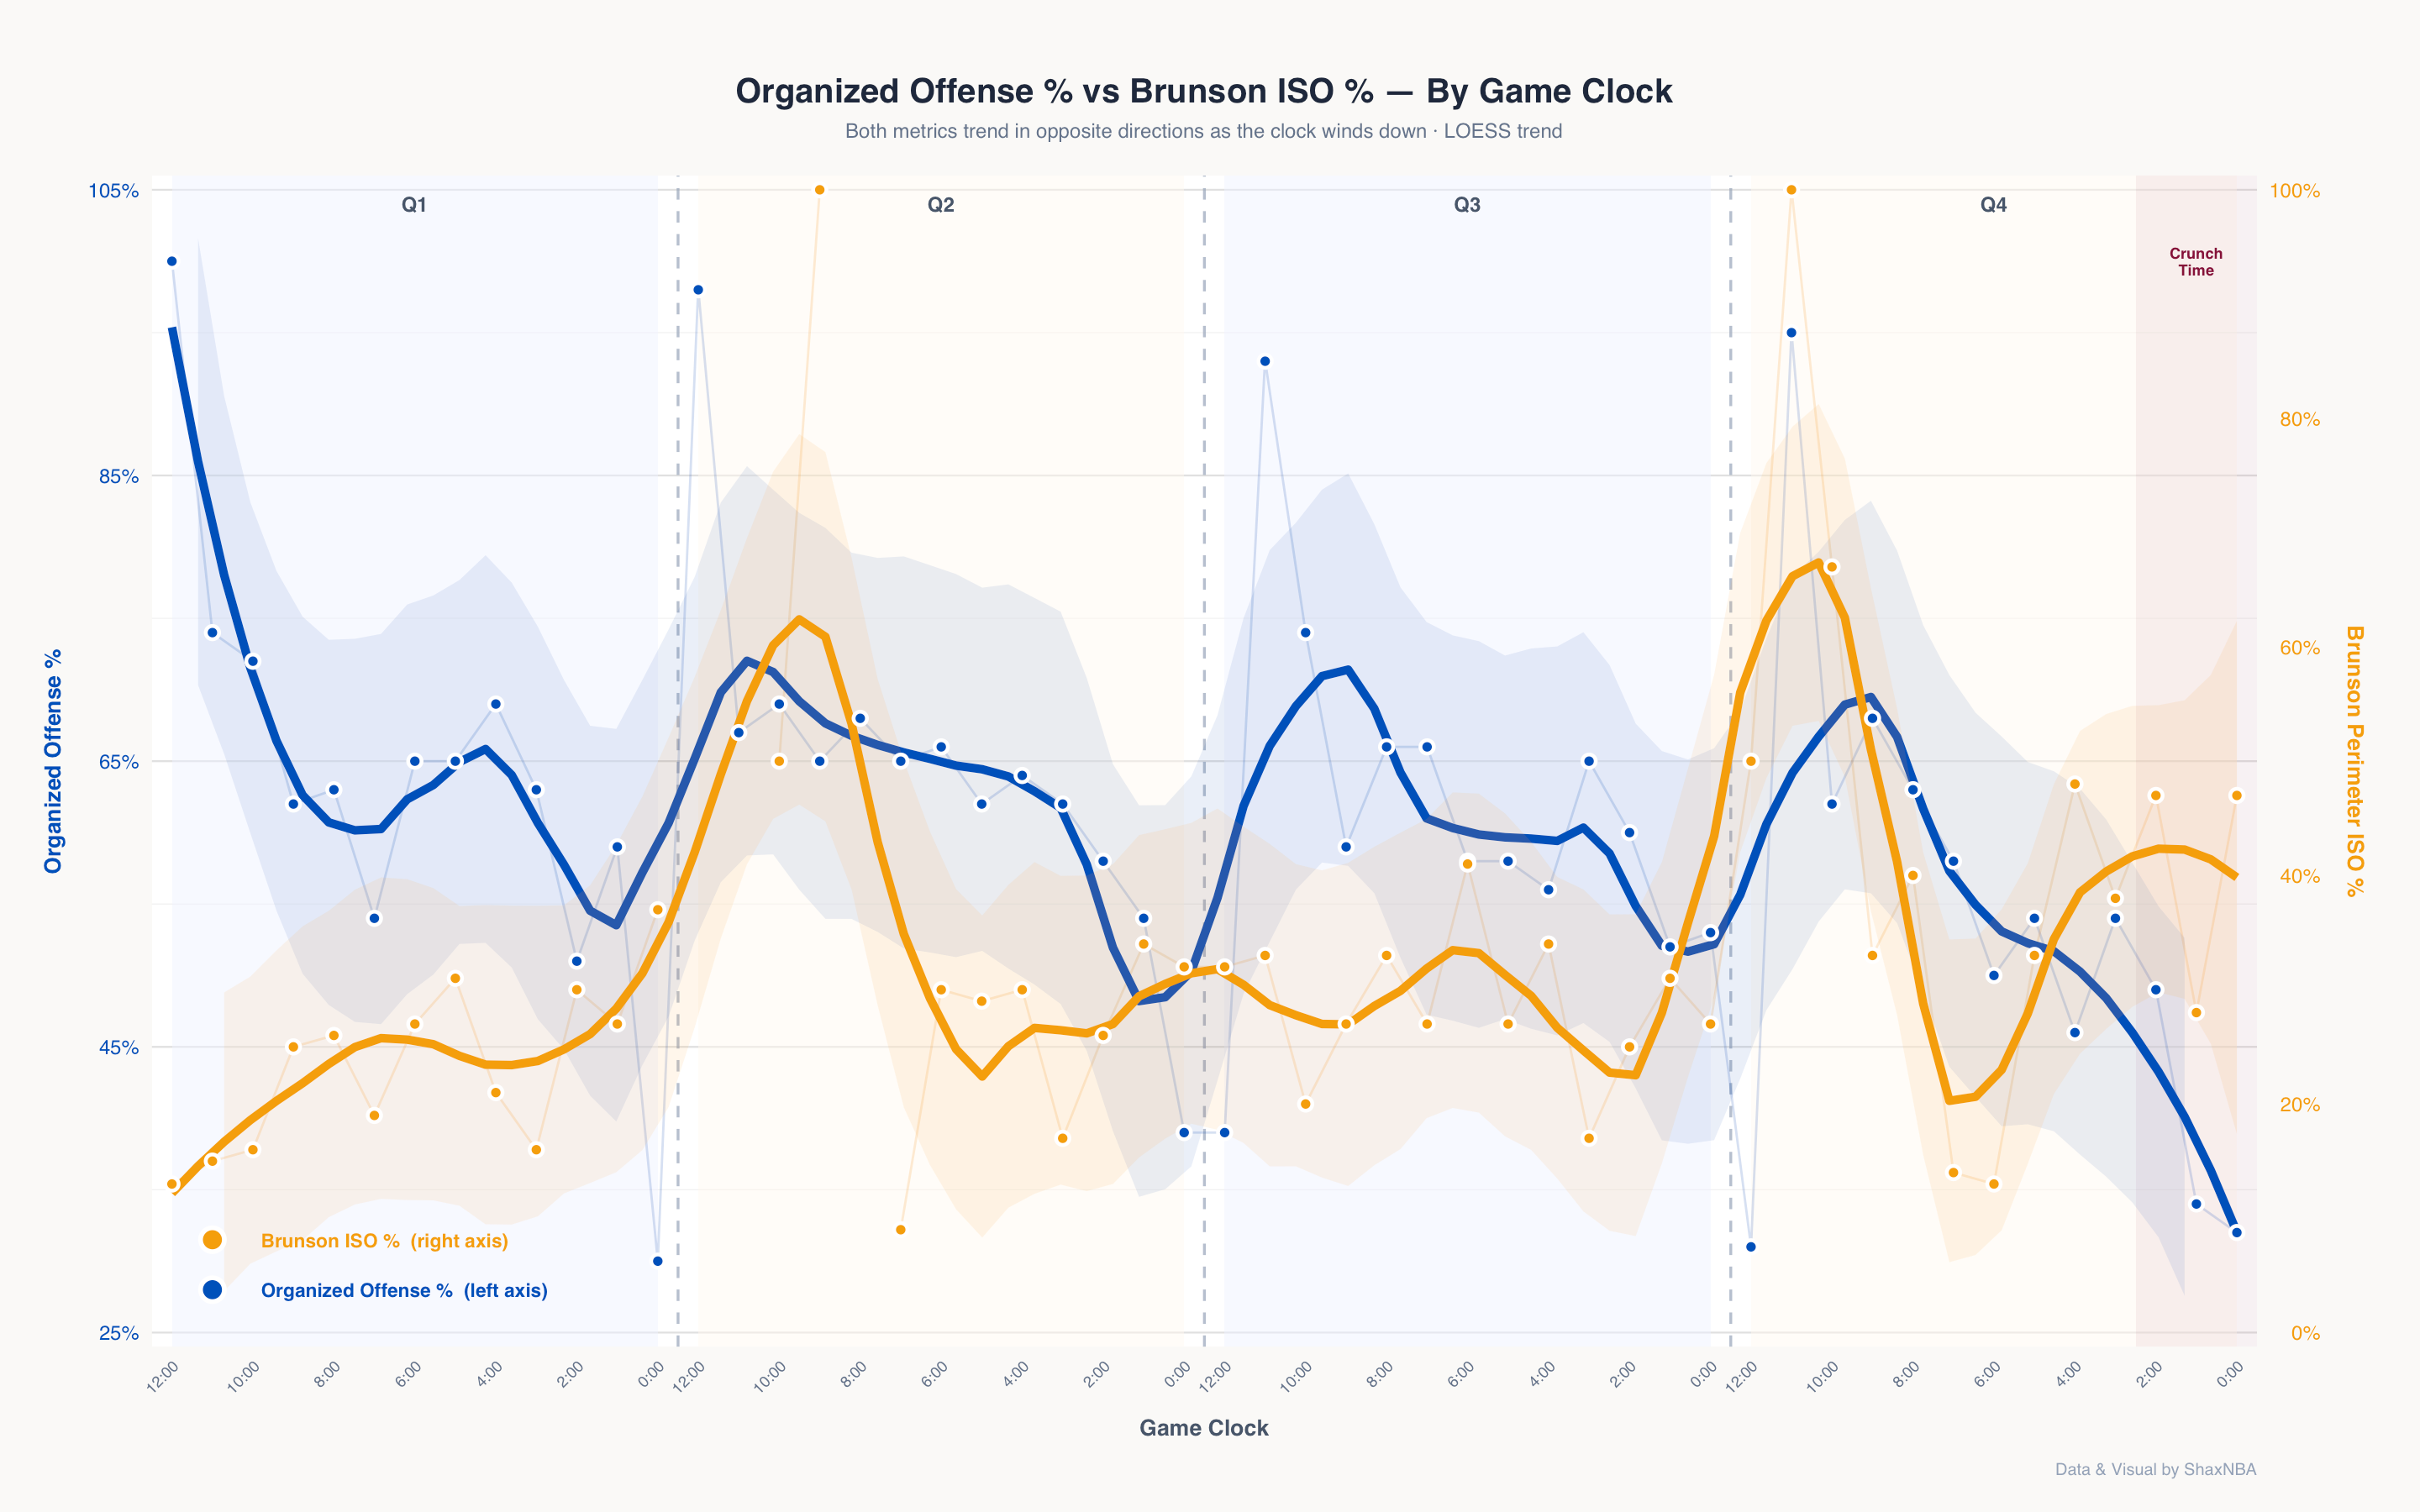
For this post, if we want to look at why the rate of offense goes down, the data backs up our previous statement. Brunson ends more possessions in isolation as organized offense dips toward the end of games, a change that begins around the 4-minute mark. Looking at each quarter in totality, Brunson finishes far more of his scoring plays in isolation during the 4th quarter than any other frame. 38% of them as isolation possessions, compared to 25% in the 1st quarter, 28% in the 2nd, and 30% in the 3rd.
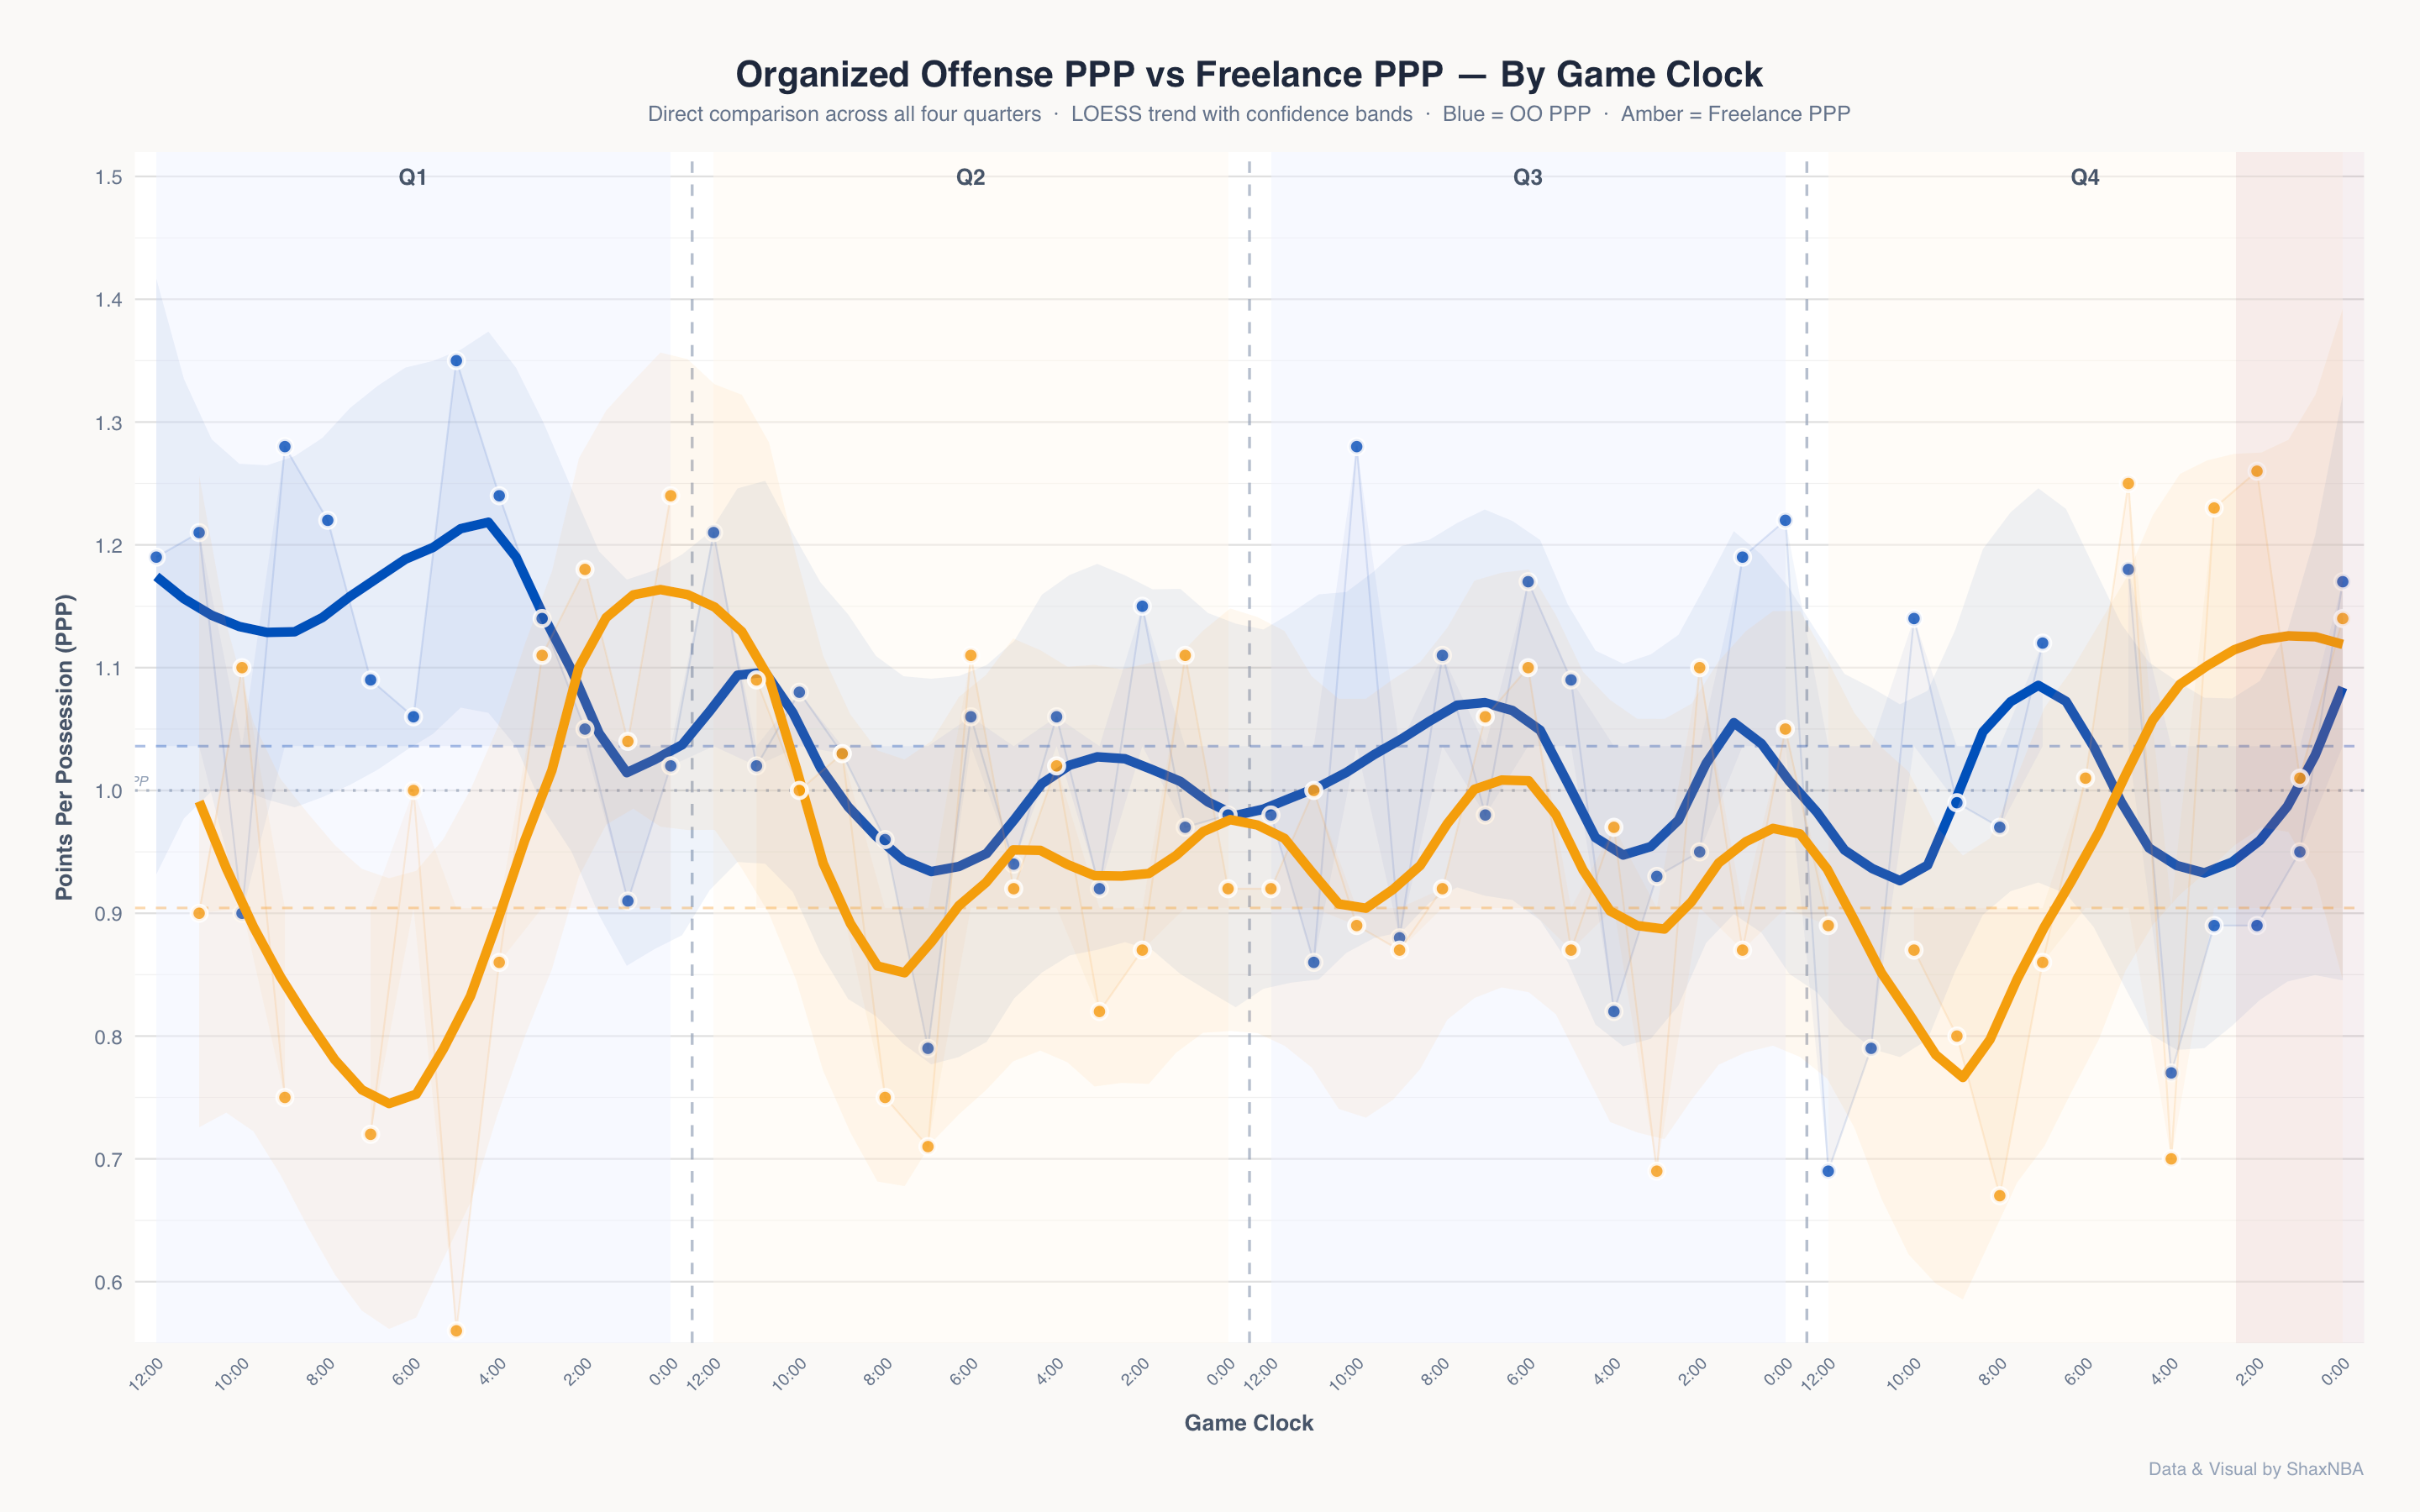
Looking at the data through the lens of game flow rather than game-by-game, freelance PPP overtakes organized offense PPP, particularly late game. That number doesn’t stem mainly from Brunson isolations, but rather from teams sending two at the ball.
For example, in Game 1 of the Eastern Conference Finals against the Cleveland Cavaliers, Cleveland blitzed an OG Anunoby ball-screen to prevent James Harden from being switched onto Brunson. Brunson immediately passed out of the trap, allowing Anunoby to attack a 2-on-1 situation. Even without a “help beater” present, Brunson’s gravity creates highly efficient, unstructured offense.
Whether operating out of a set or freelanced possession, New York's late-game offense remained elite down the stretch because the ball was in their superstar's hands.
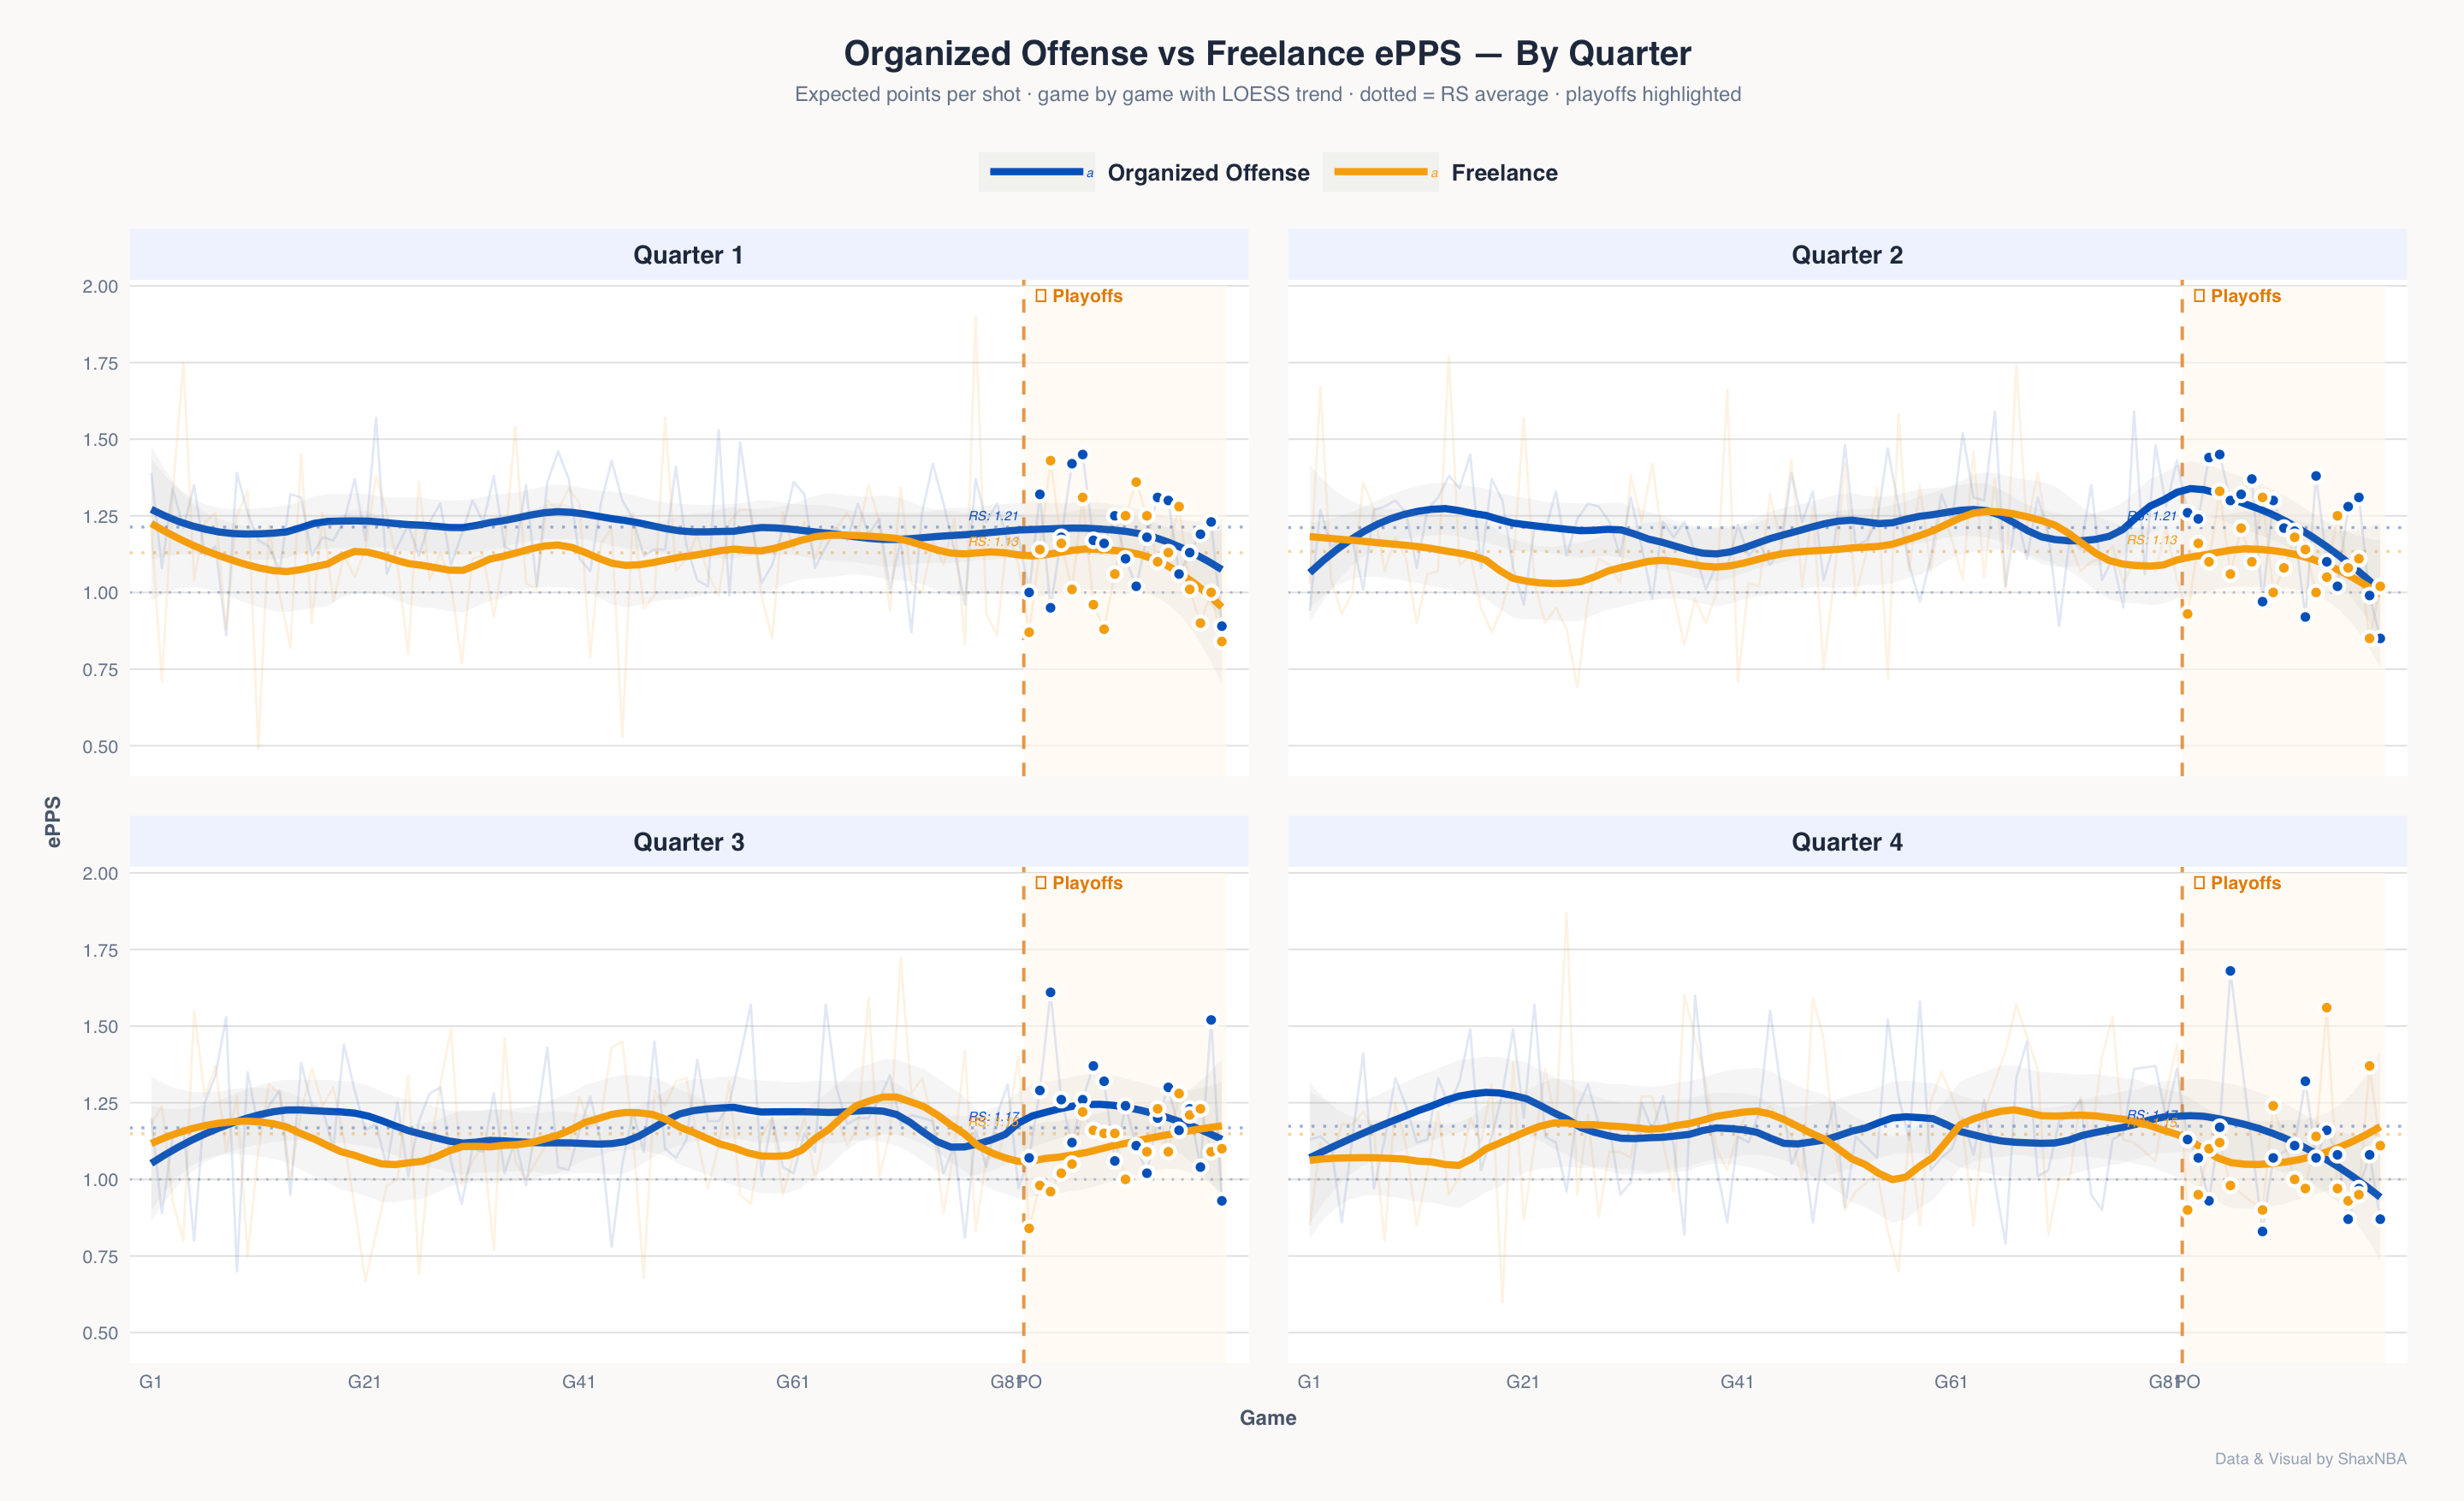
To strip away turnovers and isolate pure shot quality, we can look at expected points per shot (ePPS). Much like standard PPP, organized offense heavily dominates early in the postseason. The Knicks successfully generated high-value rim looks during the first two rounds via their pinch-post sets, therefore spiking the expected value. Interestingly, regular-season ePPS values between organized and freelance plays oscillated dramatically during second halves. I can't say for sure why it differs from the first two quarters, but tracking whether this second-half difference remains the same will be a primary focus for next season.
Conclusion
The data comprehensively supports the hypothesis: the New York Knicks are optimized by a structured, conceptual, and organized framework. This philosophy fully materialized when they replaced Tom Thibodeau with Mike Brown. The numbers can even validate it as an actionable, data-driven decision since they performed better under structure or concept and ran more of an improved offense. This change was one of the factors that paved the way for a championship run.
While Brown built the foundation of an eventual champion, freelance basketball remains New York’s closing weapon. Late in games, during the most critical possessions of the season, freelanced offense performs just as effectively or even more. Whether executing a new system, letting Jalen Brunson dissect a double-team, or beating a defender in isolation, the Knicks possess an elite, dual-threat offensive identity to unleash on the best of opponents.
Huge shoutout to @Tim_NBA (on X/Twitter), the founder of BBall Index, and the creator of the offensive tracker used in the study. None of this is possible without his assistance and guidance.