The Never Ending Roller Coaster
Data Visualization

Basketball, like baseball, football, golf, tennis, and hockey, isn't deterministic, players can execute perfectly and still fail. With shooting specifically, there are levels of skill, but even talented shooters experience some level of variance in their conversion rates. The Knicks have fluctuated this year in their overall shooting. That said, I don't believe they're three-point dependent in the way that makes them vulnerable to a Boston Celtics-style flameout come playoffs. There's no denying the stark difference between hot and cold shooting nights in today's NBA, variance matters, even if it doesn't define a team's identity. At the end of the day it’s a make or miss league:
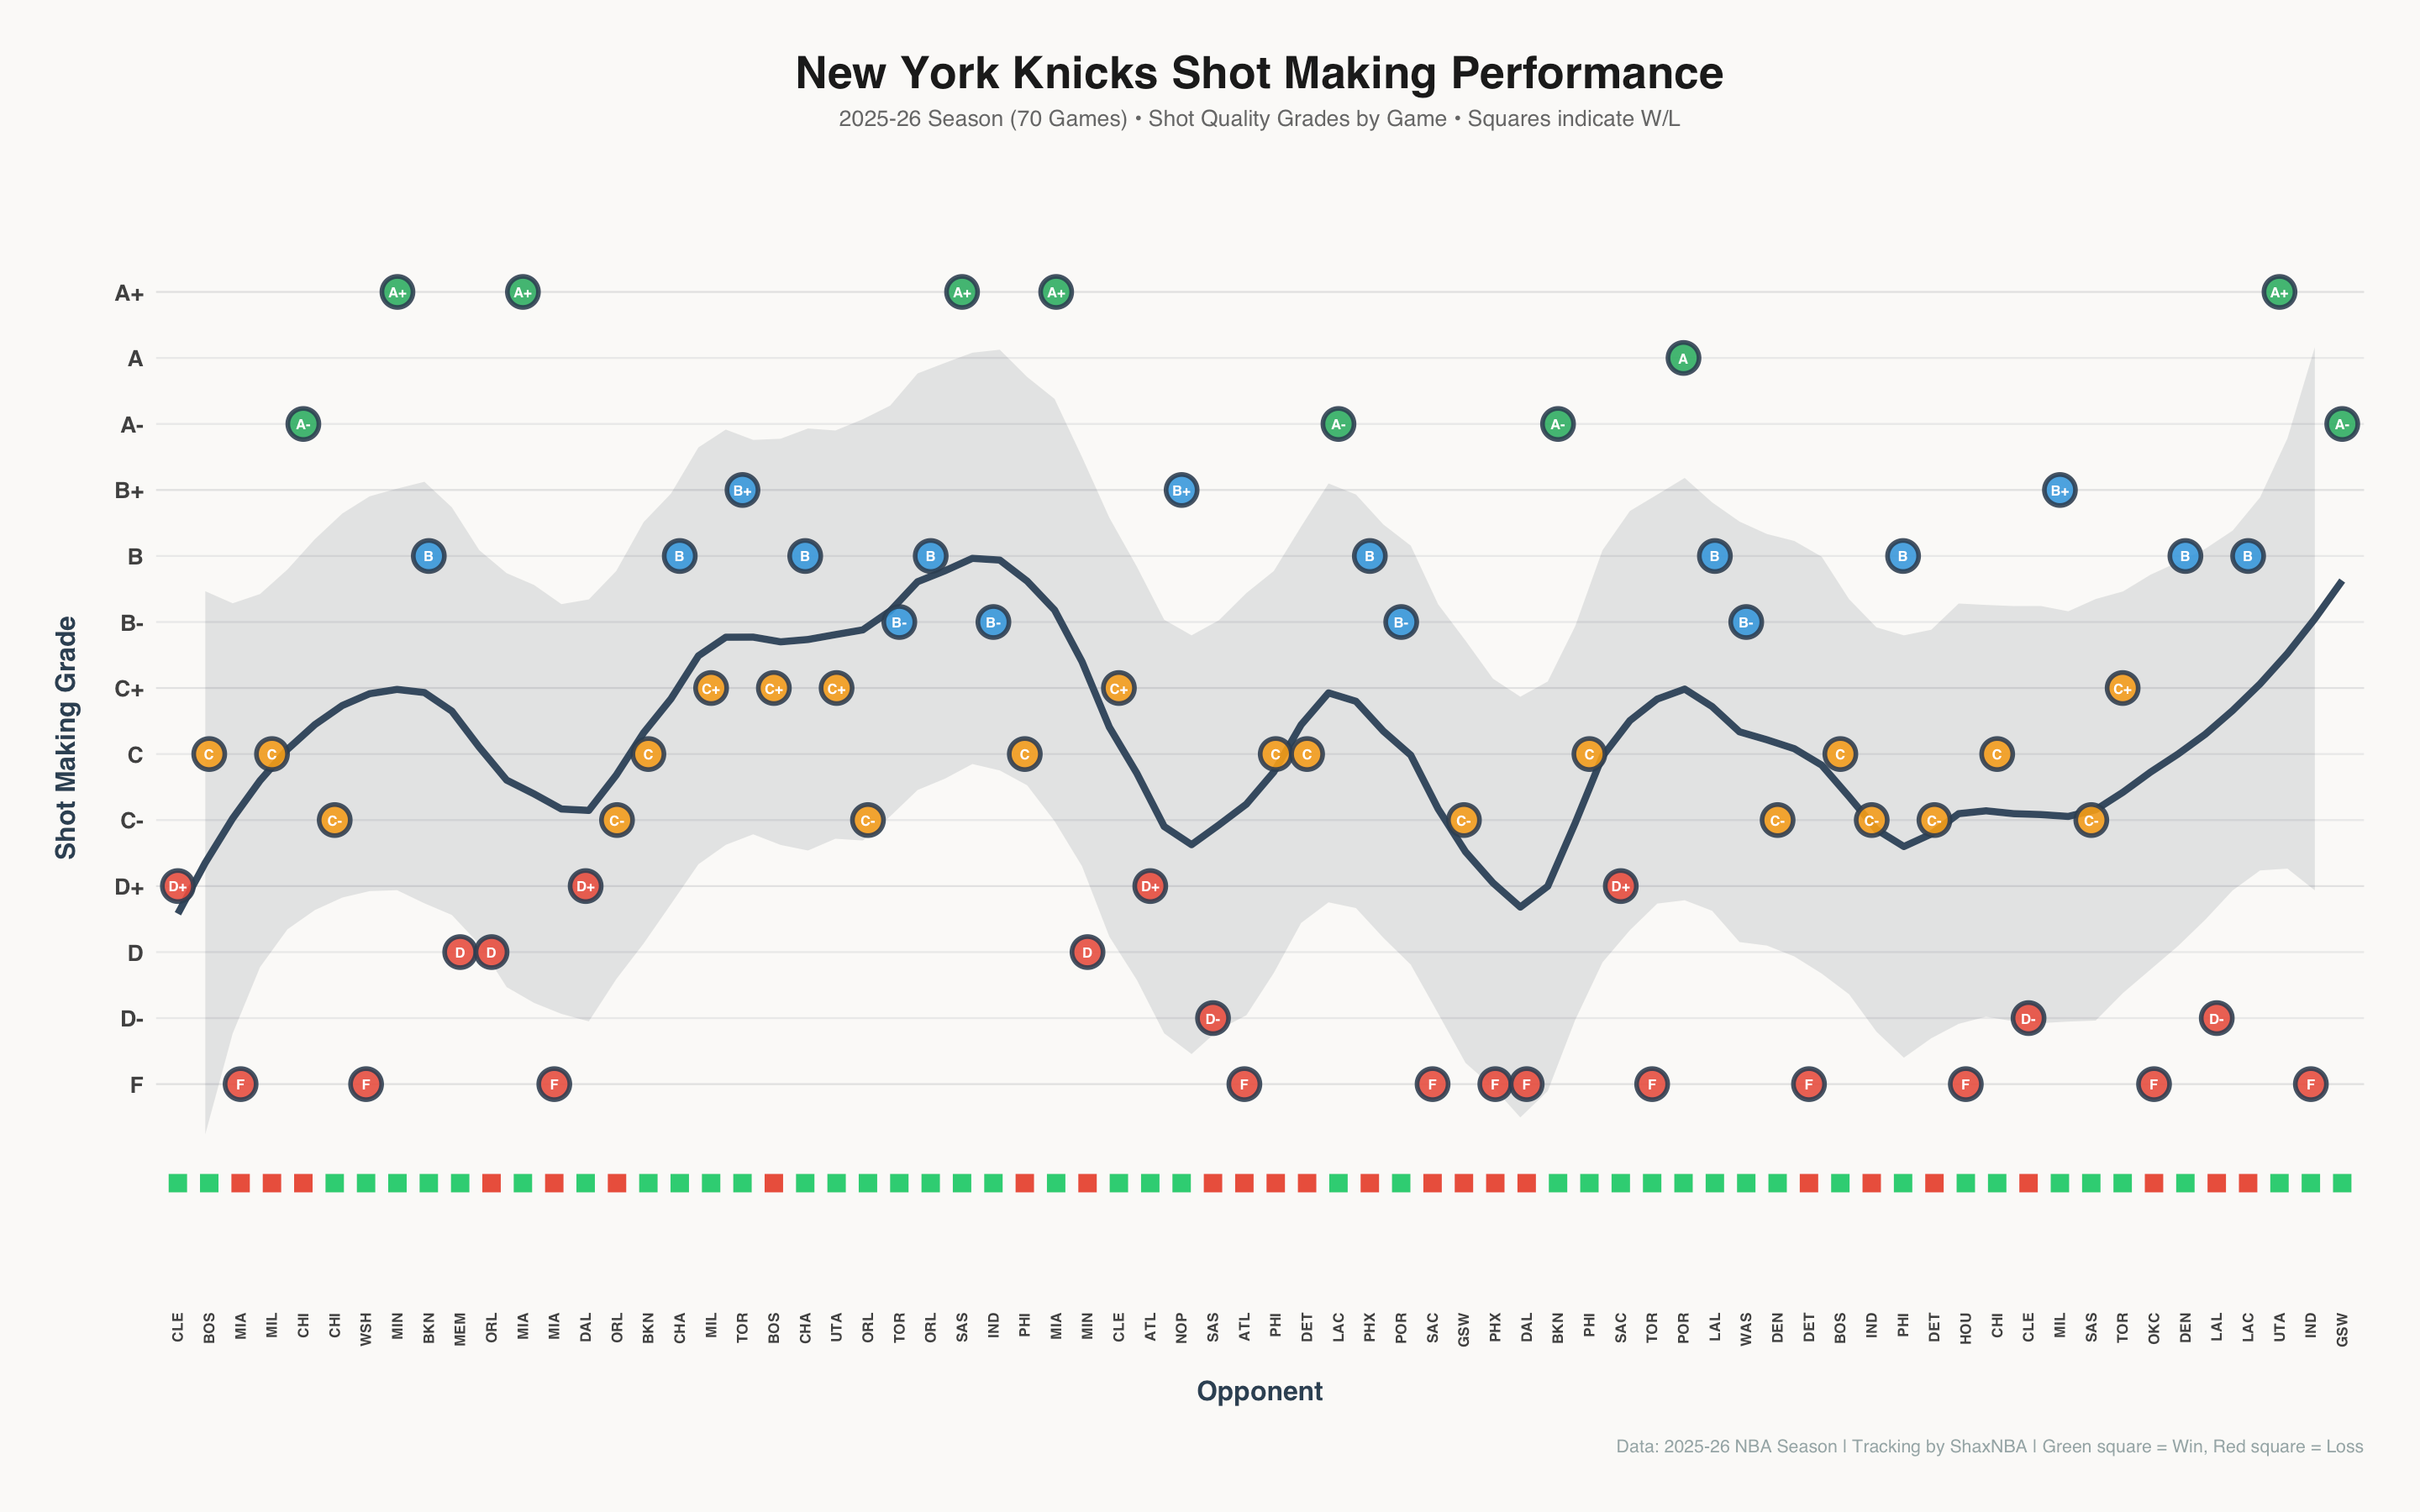
Through 70 games, this chart captures New York’s half-court shot making performance. I define shot making as the difference between actual points per shot (PPS) and expected points per shot (ePPS), where the expected value is calculated based on shot quality variables, shot type, play type, whether the shot was self-created or assisted, and location. To create game-by-game grades, I compare each game’s shot making value to the season average, making the metric team-specific rather than league-relative. Here’s an example of the math using the most recent game against Golden State:
The Knicks finished with 1.31 PPS and 1.05 ePPS, giving them a shot making value of +0.26 for the game. This indicates they shot considerably better than expected given their shot quality (lucky). When we subtract their season average shot making of +0.10, we get +0.16 which translates to an A- grade relative to their typical performance. Speaking of lucky, here are the most luckiest games of the season so far:
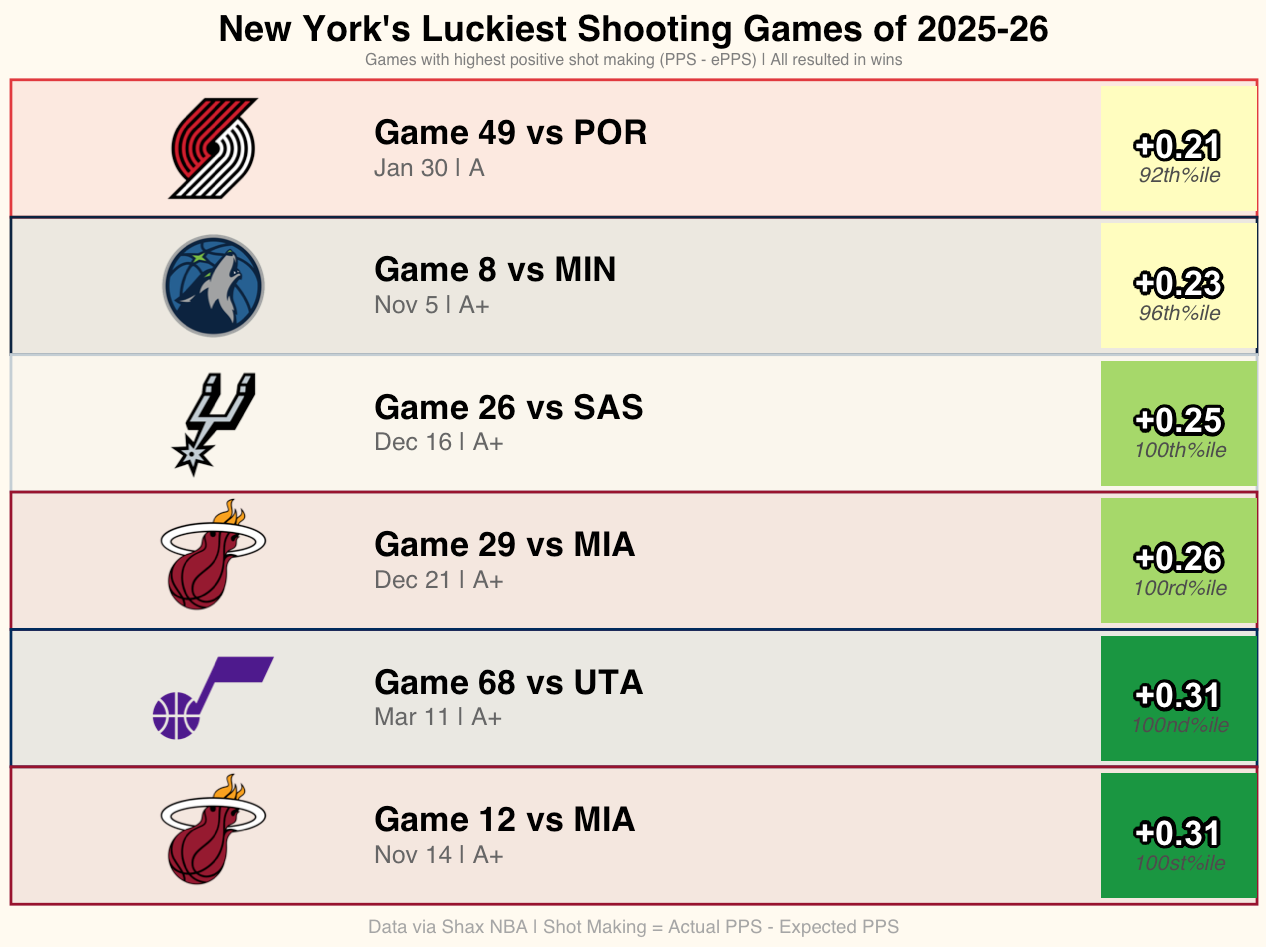
Some performances come with important context. High shot making doesn't necessarily mean poor shot quality, you can get lucky while also taking great shots. In the Utah game, for instance, the Knicks generated elite looks (1.30 ePPS) and converted them at an even higher rate (1.71 PPS), combining excellent shot selection with exceptional finishing. The San Antonio game tells a different story: the Knicks produced only 1.10 ePPS, below their season average of 1.18, yet still posted 1.45 PPS. That NBA Cup performance leaned more heavily on “shooting luck”, and if you want to feel guilty, take a moment to; I won’t, because the Knicks have had their own share of unlucky games:
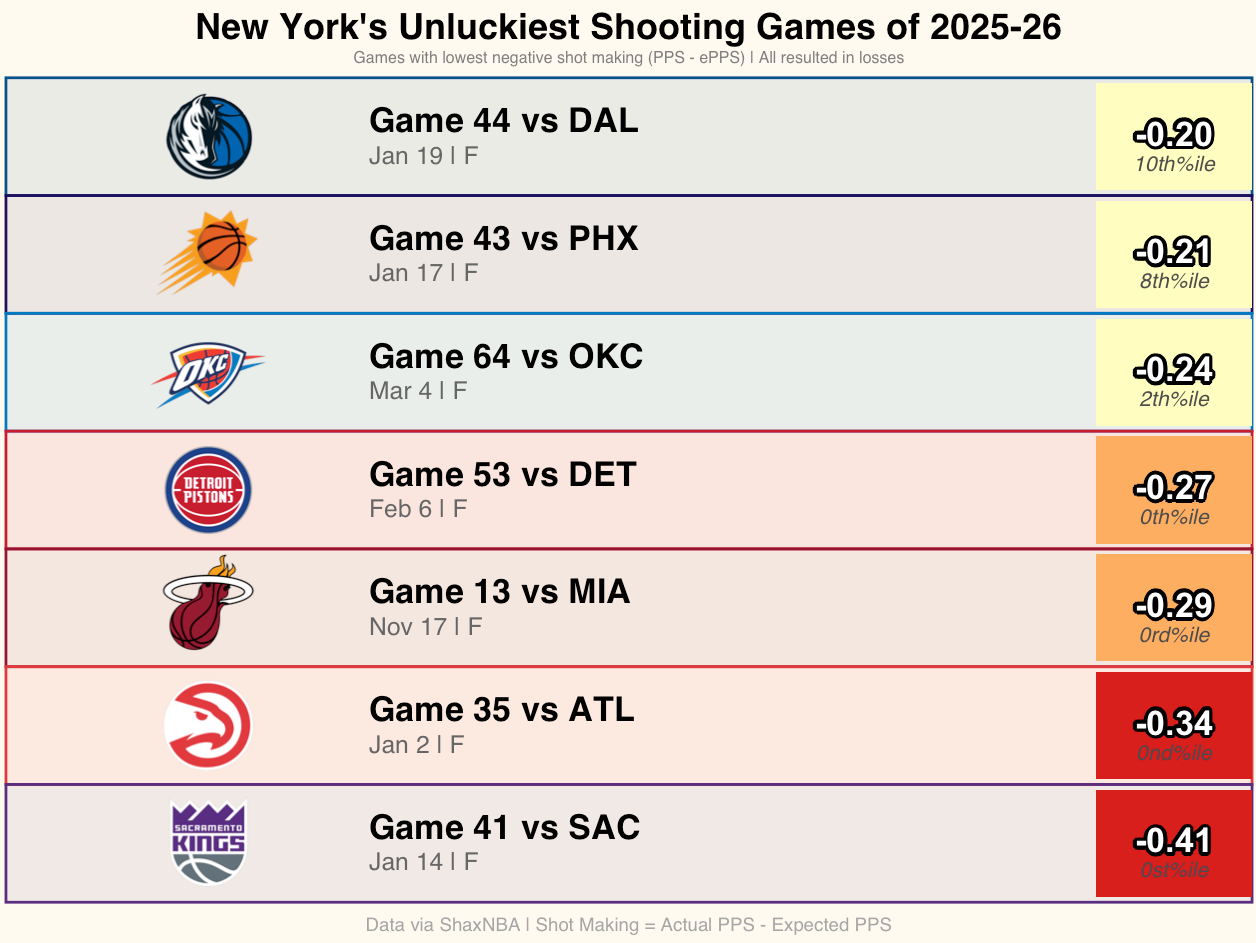
The same context applies. You can be unlucky while also taking poor shots. The Oklahoma City game for example, the Knicks had a 1.25 ePPS, but only posted 1.10 PPS, ultimately having bad luck while shooting elite looks. The contest against the Sacramento Kings is one you can laugh at, producing an abysmal 0.86 PPS despite generating 1.17 ePPS (slightly below the season average of 1.18). Detroit and Atlanta both featured 1.10 ePPS, poor shot quality compounded by cold finishing.
Breakdown of Shot Making Data
A → A+ shot making: 8 - 1 record, with the one loss coming from the Chicago Bulls early on (10/31/2025).
Above average (C+) → B+: 18 - 3 record; losses from the recent Clippers outing (3/9/2026), the Phoenix Suns (1/9/2026), and Boston Celtics (12/2/2025)
Average (C): 4 - 3 record, with losses from early January games in the 76ers and Detroit Pistons. Includes an early season loss against the Milwaukee Bucks (10/28/2025)
Below Average (C- → D-): 6 - 4 record.
F shot making: 3 - 7 record. While I believe the Knicks are not reliant on the three point shot as much as other teams, they certainly do accumulate F grade games compared to their average and below average shooting games. I would specifically cite that as a cause for concern heading into the playoffs, as shooting nights like these don’t give them a strong chance.
Shooting Changes, Notably Three Pointers
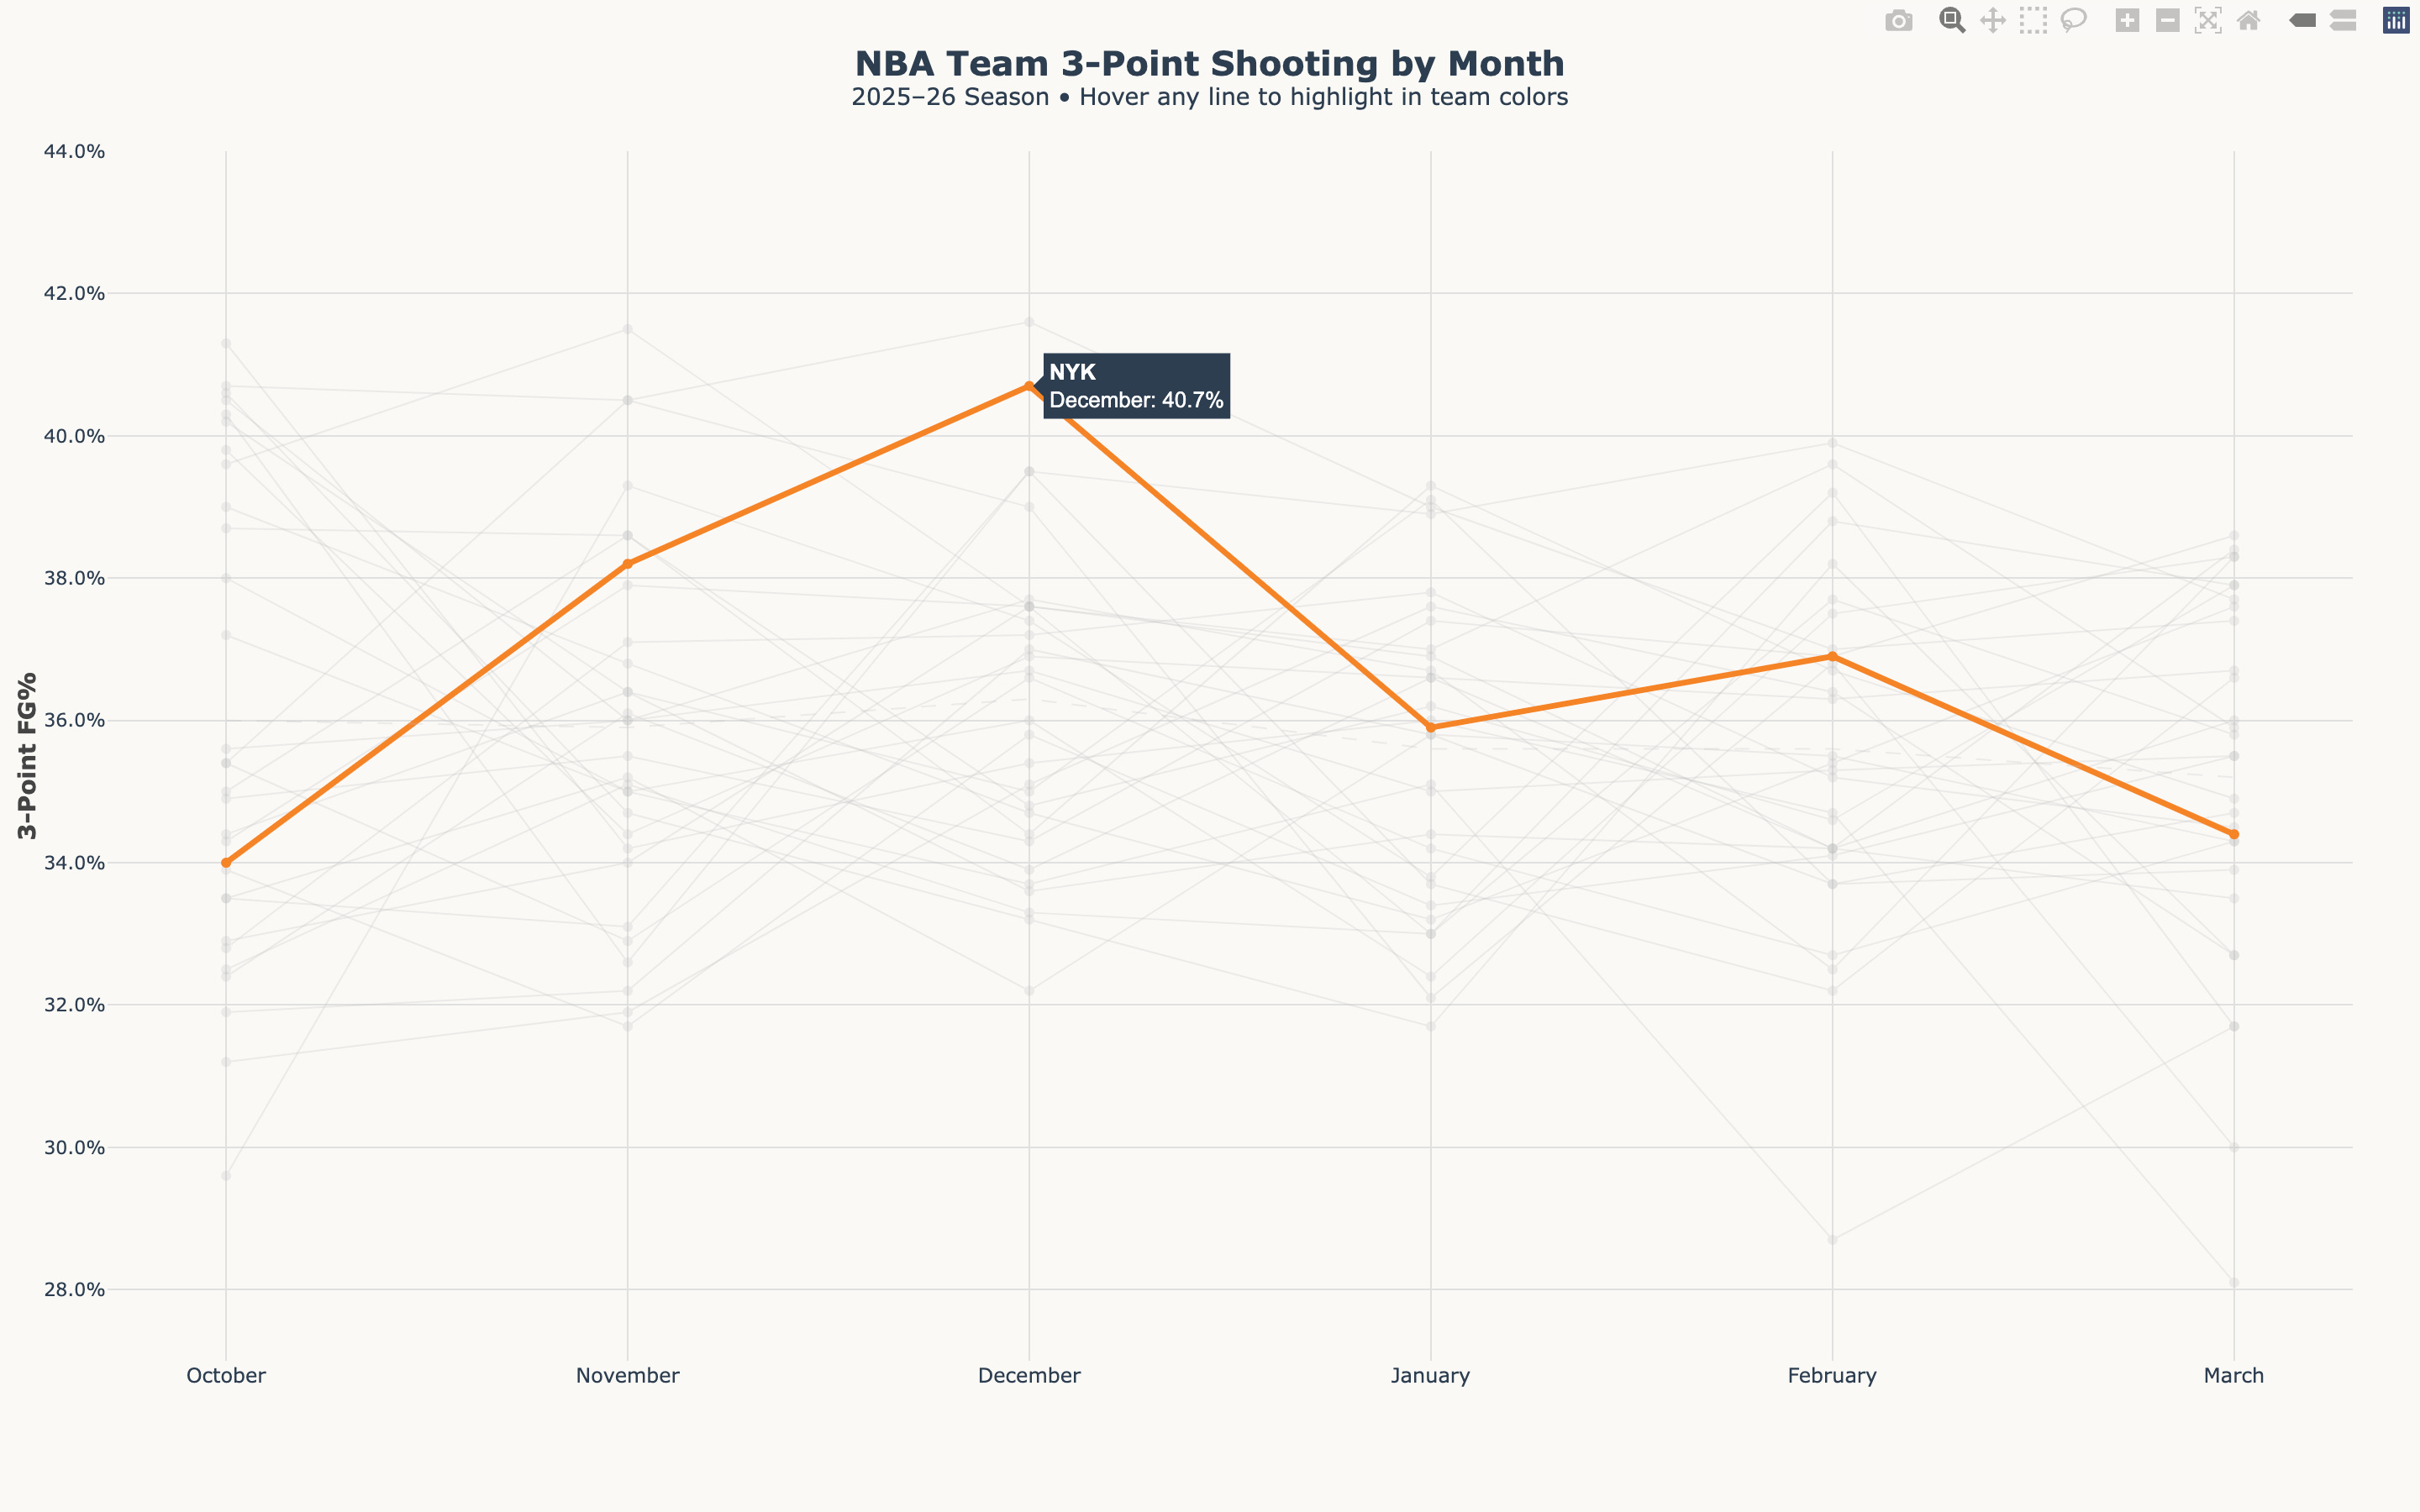
→ PRESS FOR INTERACTIVE VERSION ←
Three-point percentage is one of the most volatile stats in basketball, it swings wildly from month to month for every team in the league. While I do not have similar shot quality data for other teams, we can conclude that no team shoots it consistently all season, and the Knicks are no different.
Shoutout to David Lee for the visual design inspiration on the tables. His R codes provided the skeleton needed to create them. He does fantastic work in the NBA draft/basketball analytics space and is a must follow.